

Overview
Unexpected growth in table storage increases both infrastructure and object-storage costs. Pinot keeps a table’s data in several places — the Pinot servers’ local disks, the deep store, and the remote object stores used by tiered storage — and the Storage tab in the StarTree Data Portal reports the size at each location and highlights the gap between what should be there and what is actually stored. Use it to:- Track the total storage footprint across local disk, deep store, and tiered storage
- Spot untracked segments and stale versions that no longer belong to the table
- Find deleted segments that are past retention but still consuming deep store space
- Debug discrepancies during rebalances, segment replacement, and tiered-storage cleanup
The Storage tab and its API are available starting StarTree Cloud version 0.12.0.
Reading the Storage tab
Open a table in the Data Portal and select the Storage tab — it is the default landing tab for every table, including External (catalog) tables. The tab header has a Documentation button linking to this page and a Refresh button; the data also auto-refreshes about every 30 seconds. A fourth sub-tab, Segments, sits alongside Local/Deep/Tiered Storage — see Browsing segments below.The Storage tab and its API cover External (catalog) tables too. External Tables don’t have true local or deep storage — their segments are auto-enrolled in an S3-backed tier instead, so their Tiered Storage card is the one with meaningful numbers; Local Storage shows only each server’s preload-index/metadata-cache bytes (segments aren’t kept on local disk), and Deep Storage stays near-empty. Sizing an External Table requires crawling its S3 prefix, parallelized by key range so it fits the metadata fan-out budget — on older releases this call was skipped for External Tables and their size was left unset.
- Local Storage
- Deep Storage
- Tiered Storage
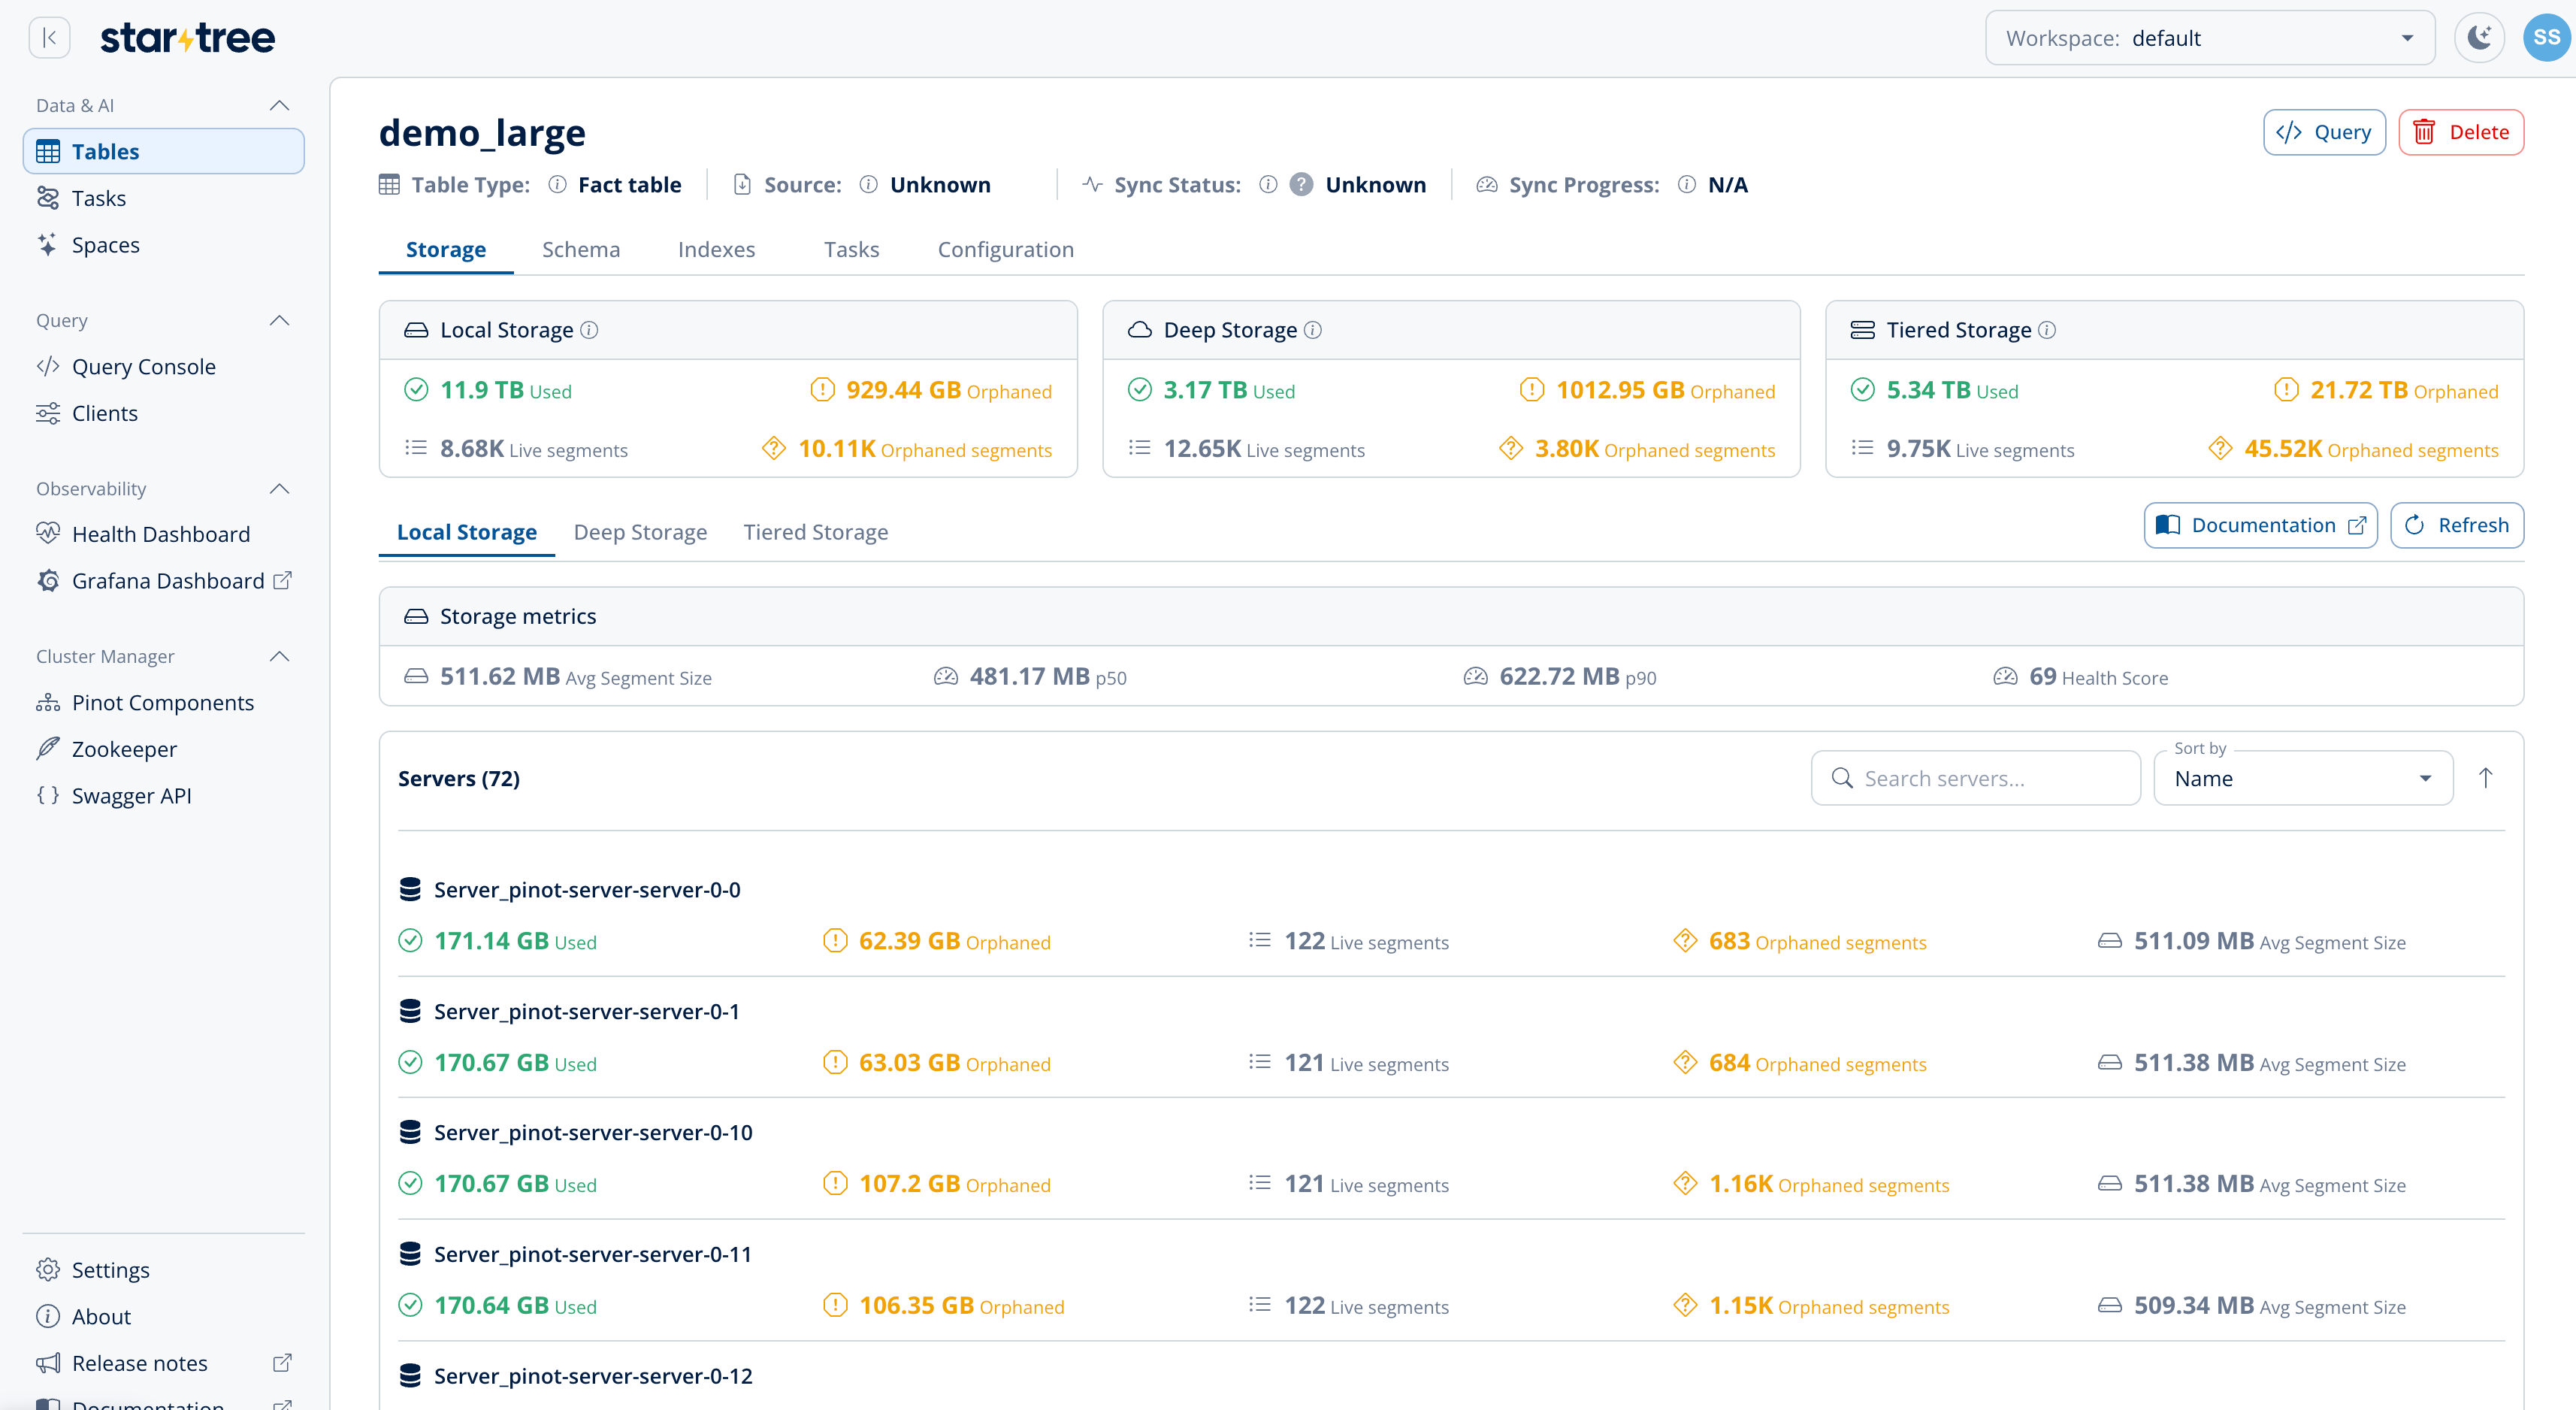
Local Storage tab — storage metrics, segment-size percentiles, Health Score, and per-server usage
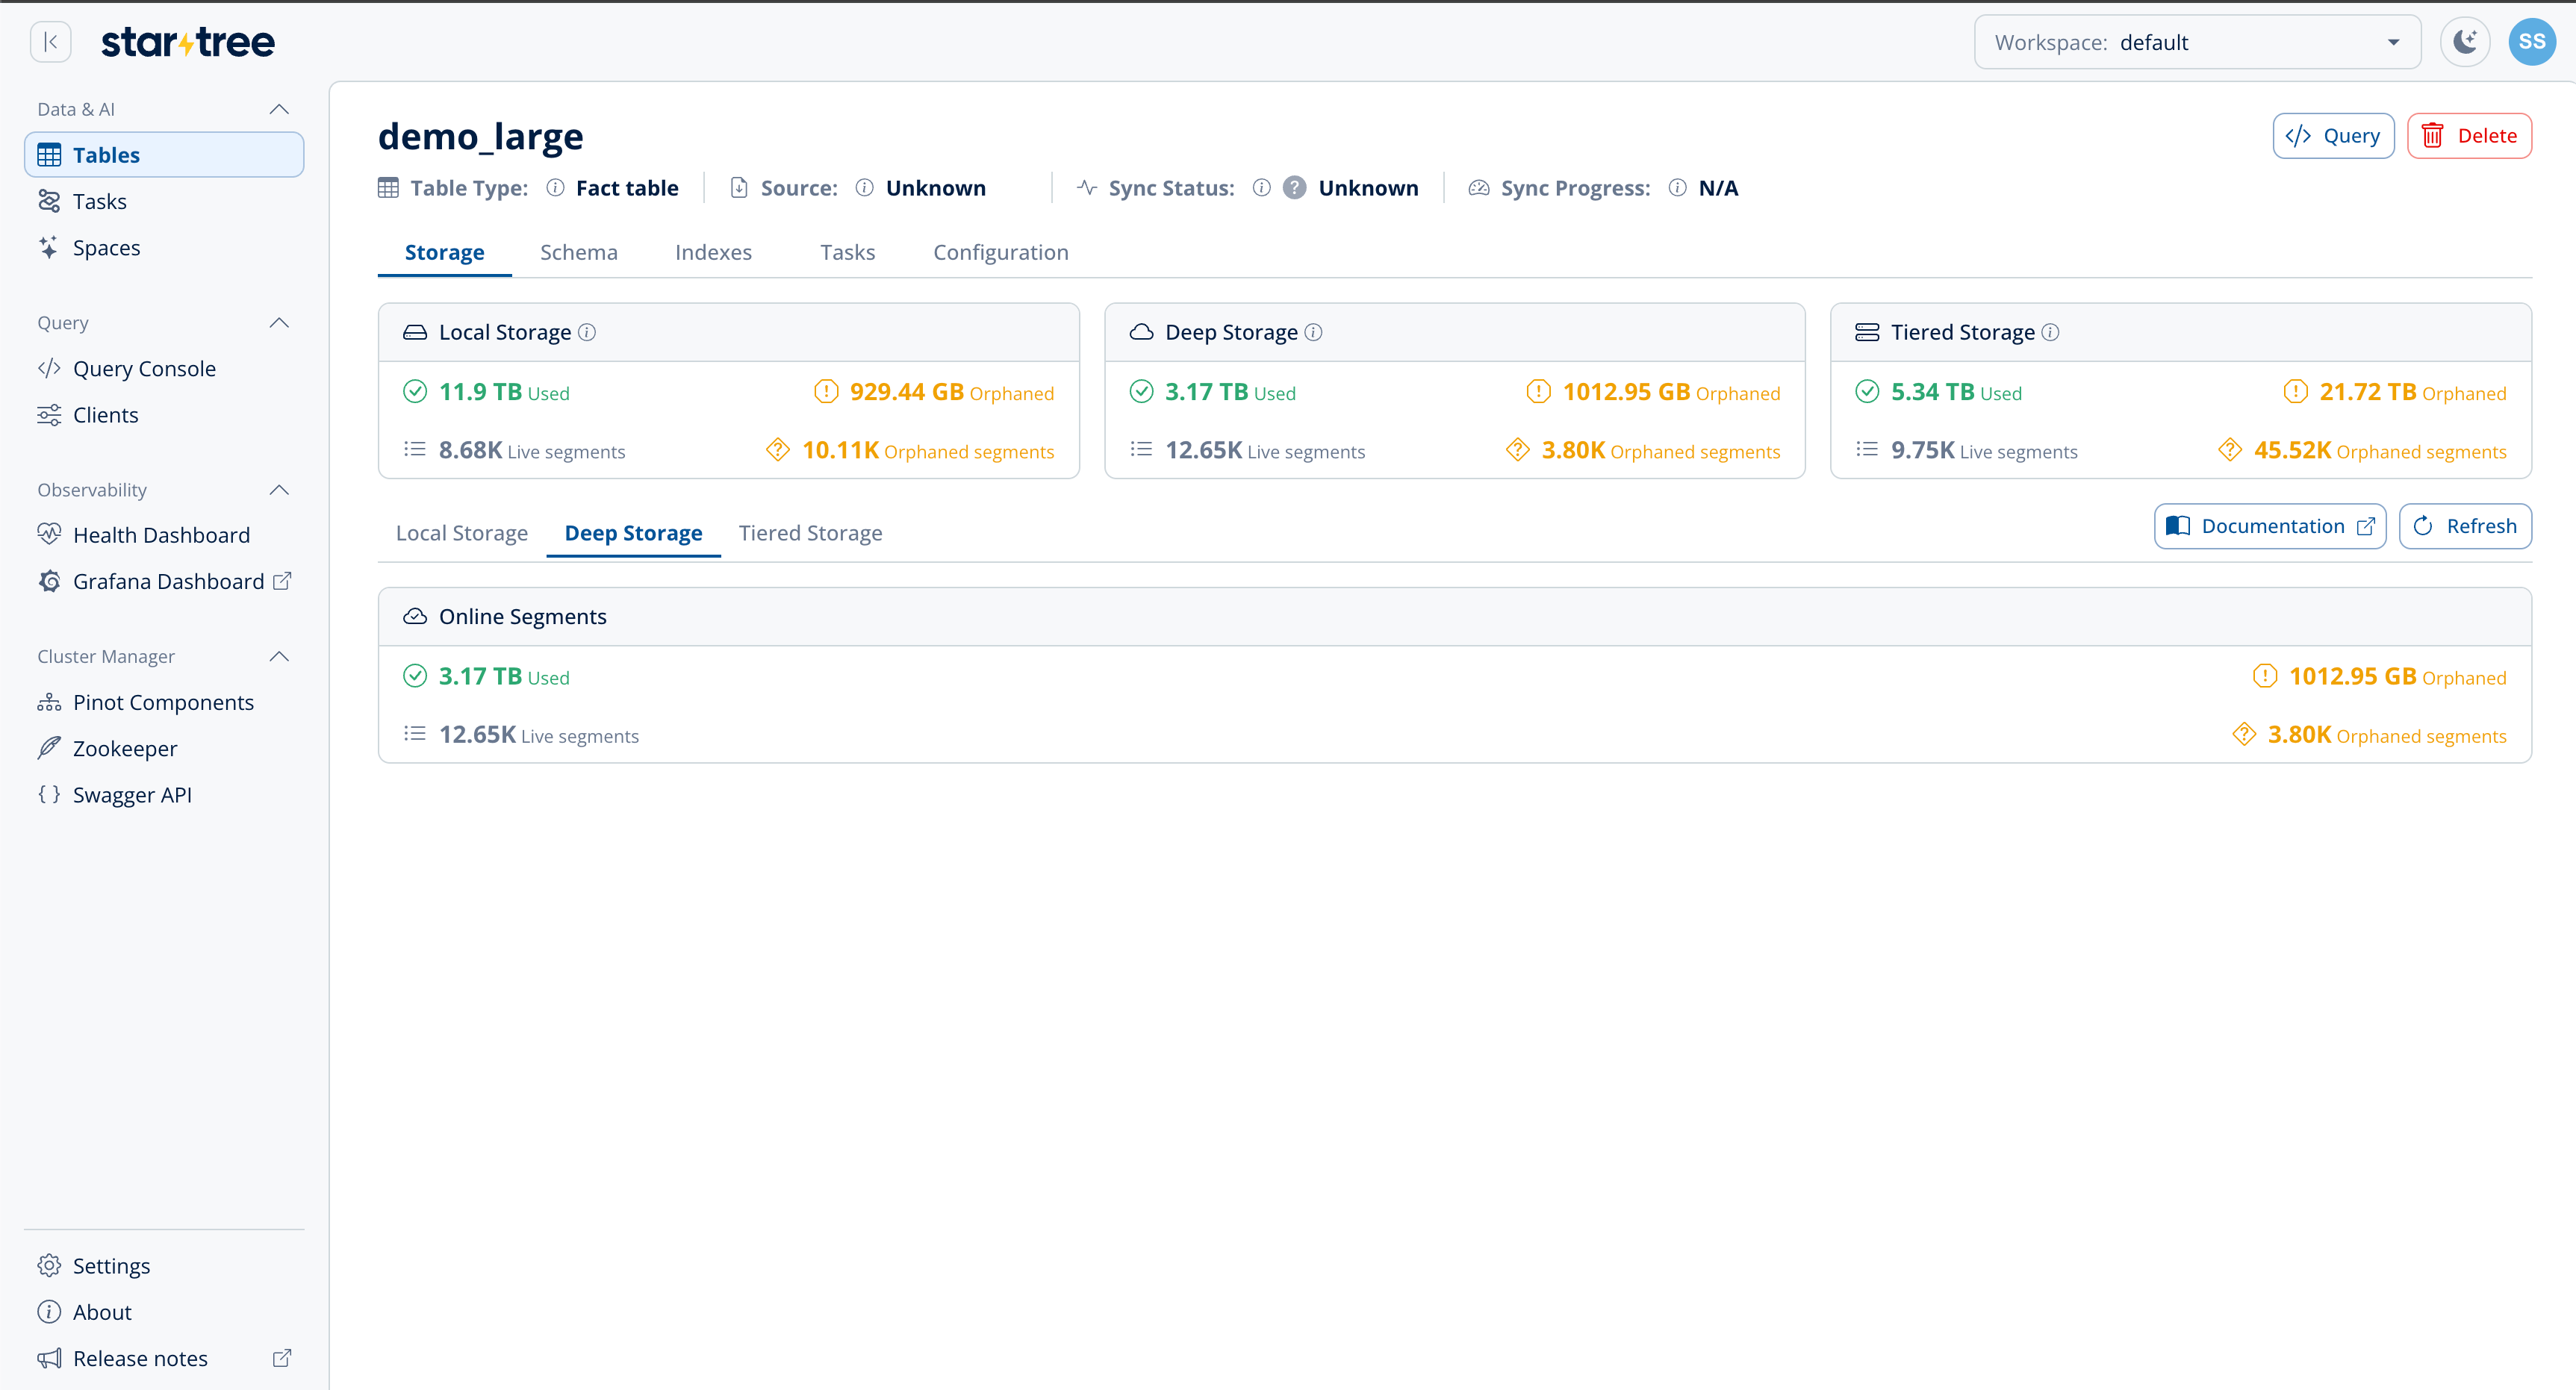
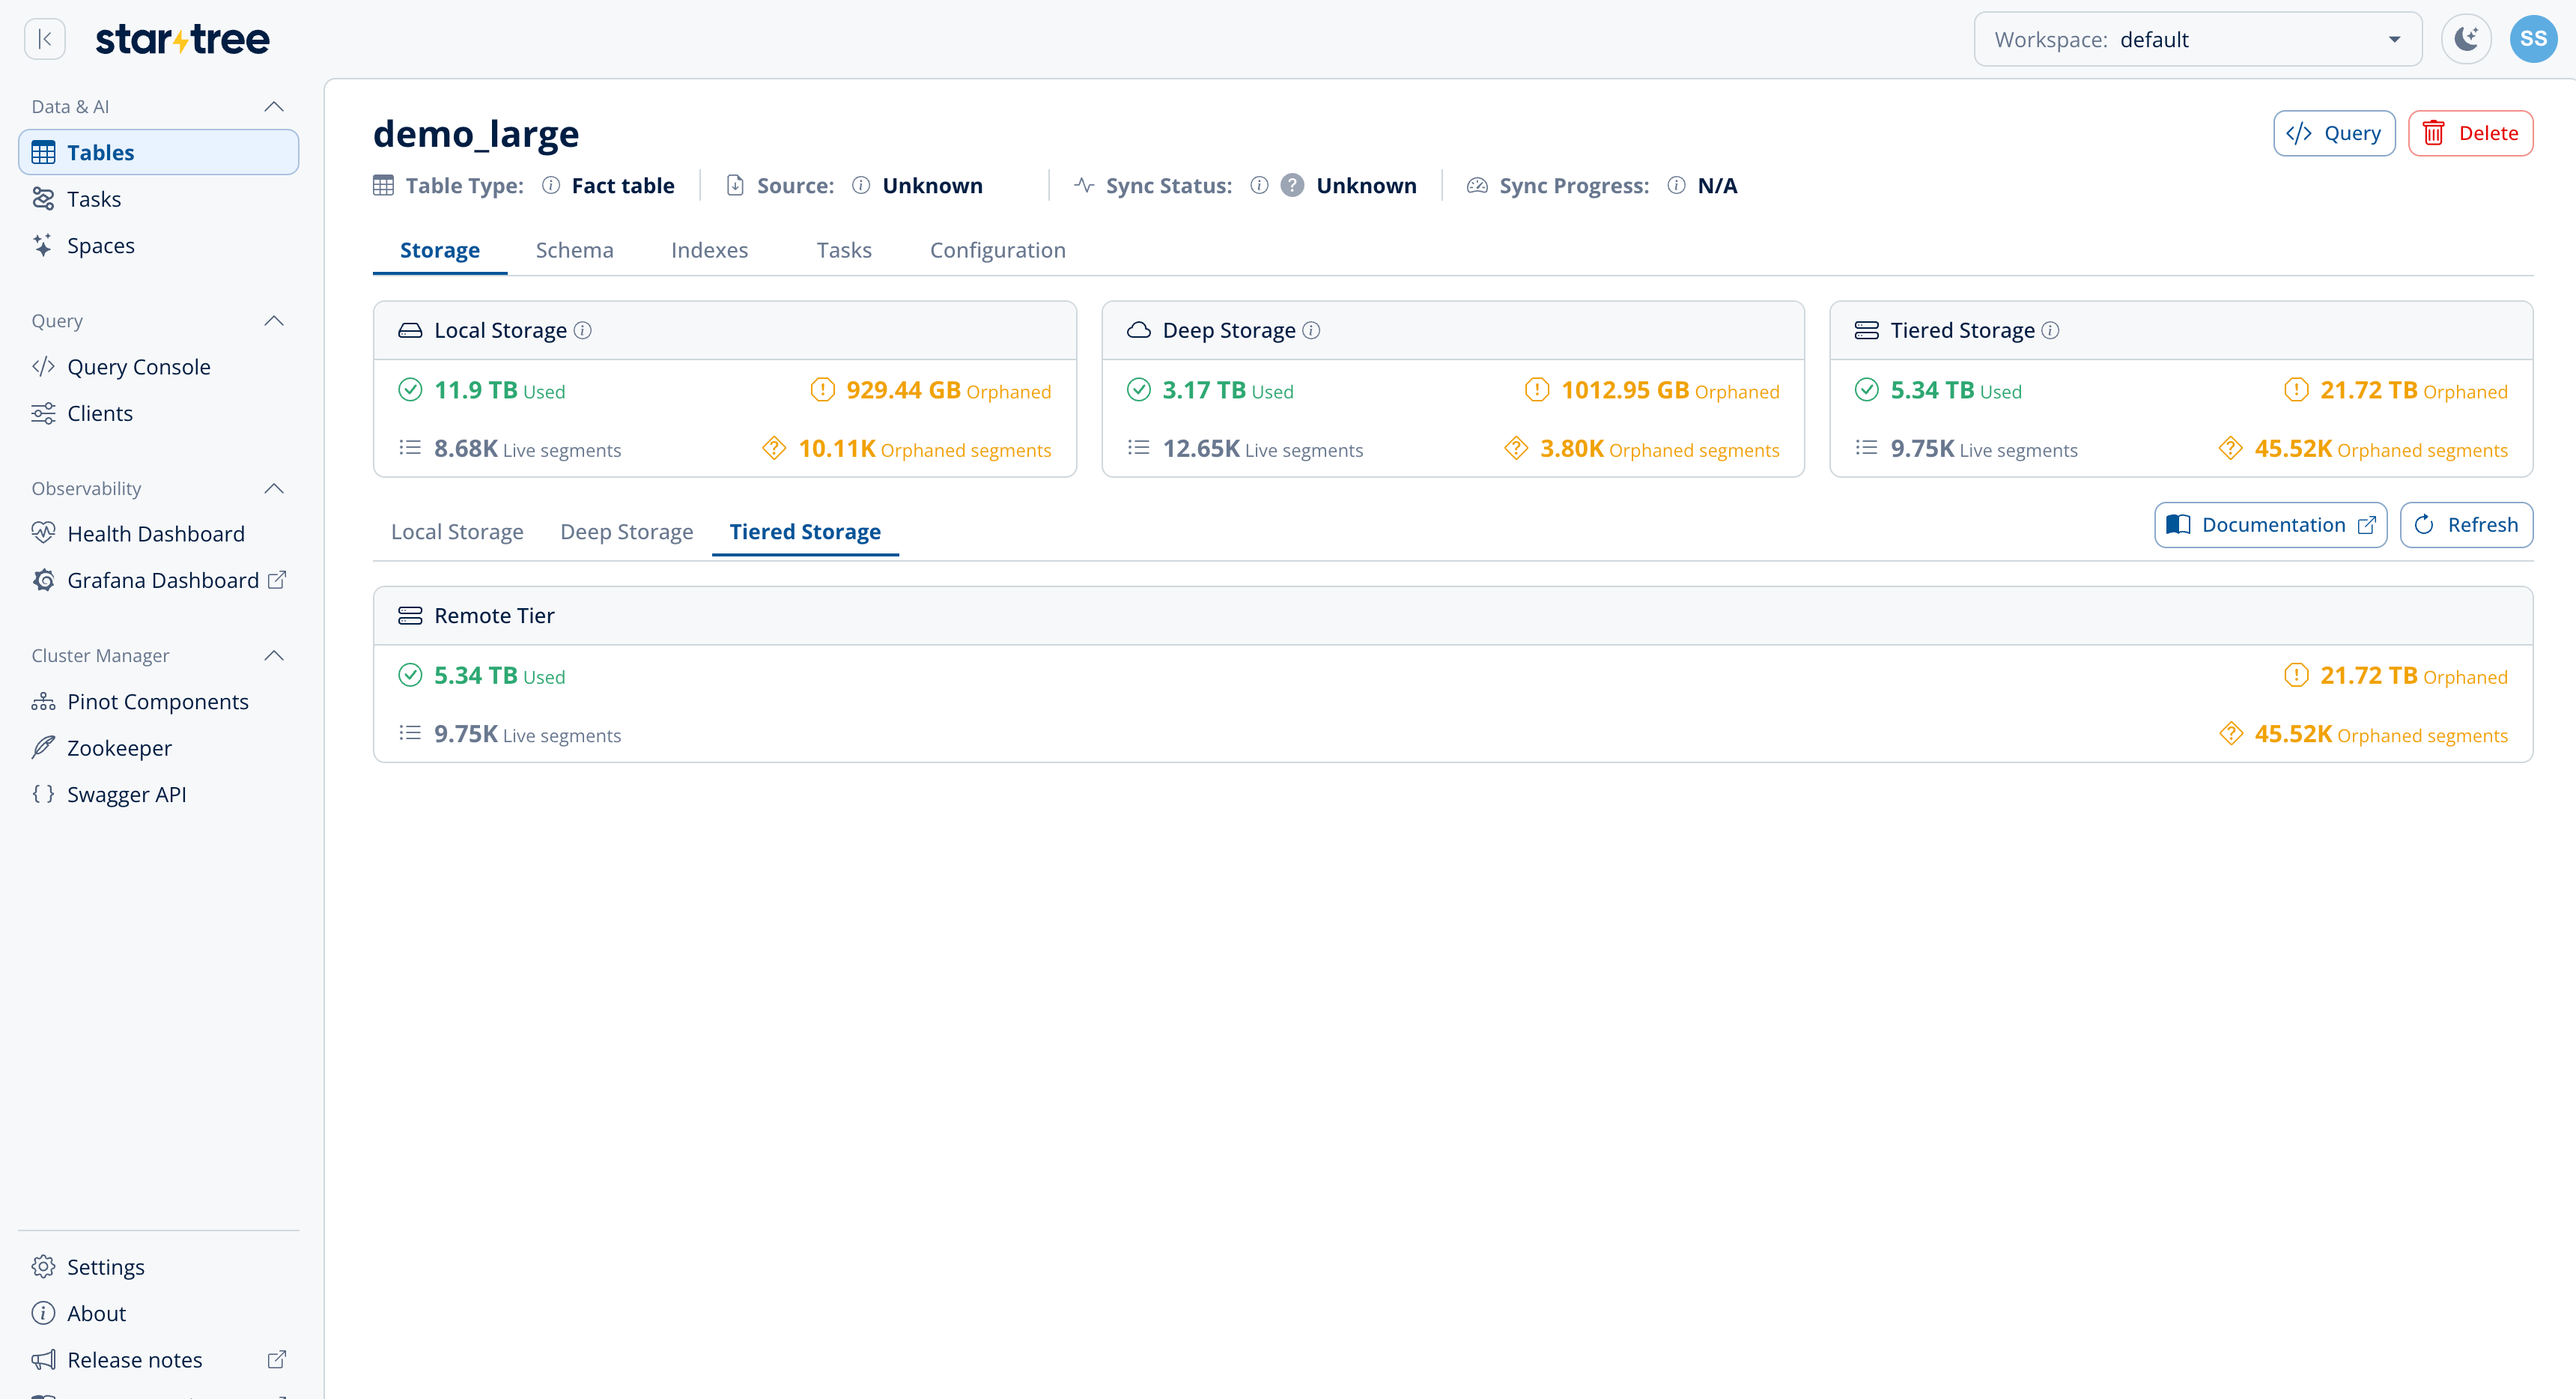
What each number means
Every card shows the same set of figures:Because Used counts only live storage, cleaning up orphaned data shrinks the Orphaned figure while Used stays the same. Exact counts are shown in the stat tooltips (displayed values are compacted).
Deep Storage breakdown
The Deep Storage card expands into per-area cards so you can see which part of the deep store is using space:
The Deleted, Upsert, and Dedupe cards appear only when they hold data.
The Local Storage sub-tab also lists every server under a Servers (N) header, with a search box, a Sort by selector (Name, Used storage, Orphaned storage, Live segments, Orphaned segments, Avg segment size), and an ascending/descending toggle — useful for finding the server that holds the orphaned bytes on a large cluster.
Segment-size health (Local Storage)
The Local Storage tab also shows two segment-size percentiles — p50 (the median) and p90 — plus a Health Score from 0 to 100. The Health Score stat links back to this section. Think of the Health Score as a report card for how well your segments are sized. It has nothing to do with orphaned storage — it looks only at segment sizes. It starts at 100 and subtracts points for two problems:- Skew — segments of very uneven size, i.e. a big gap between p50 and p90.
- Oversized segments — a p90 that is large in absolute terms, measured against a ~500 MB reference.
A low score points to segment-sizing work: if segments are small and uneven, merge small segments; if they are too large, revisit the segment threshold. A high score means your segments are consistently sized in a healthy range.
The Health Score is a heuristic computed by the Data Portal, not a value the API returns — the 500 MB reference and the point weights are guidance, not a hard SLA. To reproduce or alert on it, recompute it from the
p50 / p90 figures the API returns under serverAggregateSegmentSizeStats. It shows N/A until both percentiles are available.Browsing segments
The Segments sub-tab lists every segment in the table individually — a grid with Segment Name, Status (Good / Bad / Updating / Unknown, with a summary chip per status), Servers, Size per replica, Size (all replicas), Total docs, and Created At, plus a size-distribution chart, a storage-concentration chart, and a per-server filter. Clicking a server on the Local Storage tab jumps here pre-filtered to that server. Opening a segment (or its View Metadata action) shows a data vs. index size breakdown and a per-column index matrix — which index types (inverted, forward, min/max, etc.) each column carries and how many bytes each one uses — plus the top columns by size. Each segment also exposes Reload, Reset, and Delete actions from a row menu.The Segments tab and its data-vs-index / index-matrix breakdown reflect what the underlying Pinot segment metadata reports; they are a Data Portal convenience view, not a separate API surface documented on this page.
Reloading segments
The Segments sub-tab header carries a Reload all button alongside the per-segment Reload row action, and a warning banner appears on the Storage tab whenever existing segments are out of date with the table’s current config or schema. All three routes — Reload all, the banner’s Estimate & Analyze, and the per-segment action — open the same Reload segments dialog, which runs a dry-run estimate before anything changes:- Segments / copies affected, sampled across up to 3 segments per server.
- Rebuild time, estimated from the sampled segments.
- Disk, the net size change across all copies.
- Net index changes, added/removed indexes per column.
The dry-run estimate is temporarily unavailable (large tables were filling server
/tmp). While this is off, Reload all, Estimate & Analyze (labeled Reload segments in this state), and the post-save prompt skip straight to a confirm-only dialog: it still waits for Reload before doing anything, but it no longer pre-samples segments for failures or reports segments/copies affected, rebuild time, disk impact, or index changes up front — a failure surfaces only if the reload itself is attempted and fails. This is expected to be restored in a future release.Saving a table config or schema change now surfaces this same dialog automatically: a Configs updated successfully prompt checks whether the existing segments are now stale and offers to estimate the impact or reload immediately. This replaces the previous flow, which left finishing the reload to Pinot Admin.
Understanding the numbers
Used, orphaned, and expected
Two ideas explain every figure on the tab:- Used is the live, expected storage — what should be there.
- Orphaned is storage present at the location but not backed by the table’s current metadata.
Used = actualSizeInBytes − unexpectedSizeInBytes and Orphaned = unexpectedSizeInBytes.)
Storage is expected when it is a live segment recorded in the table’s metadata, or a deleted segment still inside its retention window. Everything else is orphaned.
What “Orphaned” includes
The Orphaned figure is a single number, but it bundles three different situations, each with a different cause and a different fix:“Orphaned” means the combined total, not one category. The Storage tab shows a single number labeled Orphaned for all three of the above added together. This trips people up because “orphan segment” is also used loosely to mean just the first category — files with no metadata. Throughout this page, Orphaned always refers to the combined Data Portal total; the no-metadata files are called unknown items (the API’s
unknownItems). A large Orphaned figure can therefore be entirely stale versions or beyond-retention segments, with zero unknown items. Hovering the Orphaned stat shows the per-category split — stale versions + unknown items on the Local and Tiered cards, unknown items + beyond-retention segments on the Deep Storage card. The API calls this same combined total unexpected; to see the split with the individual item names, call it at verbose=2 (see Using the storage usage API).Stale versions count toward the Orphaned size but not toward the Orphaned segments count. This is why a table can show a large Orphaned size with zero Orphaned segments — the excess is entirely stale versions.
Why these numbers differ from the old Pinot table size
If you are used to the OSS Pinot table size API (GET /tables/{tableName}/size, shown as Reported Size and Estimated Size in the Pinot console), the numbers here will look different, and usually larger. That is expected: the two answer different questions.
How
getTableSize computes Reported Size. For each served segment it polls every server that hosts a replica and reads that replica’s on-disk size:
Estimated ≥ Reported), a segment whose replicas all fail to report is flagged missing and contributes nothing, and nothing outside the Pinot servers is ever counted — no deep store, no tiered storage.
Mapping the old numbers:
- The old Reported Size maps most closely to Local Storage → Used: both sum the on-disk size of served segments across all replicas. Local Storage can differ slightly because it also includes the tiered-storage preload and metadata caches (orphaned local files are excluded from Used and reported under Orphaned instead).
- The old Reported Size Per Replica ≈ Local Storage → Used ÷ replication factor.
- Deep Storage and Tiered Storage have no counterpart in
getTableSize. This is usually why the totals look much larger than before: the deep store keeps a durable copy of every segment, and tiered storage holds cold data that servers no longer keep fully on local disk. The old API never counted either.
The two views are complementary. Use
getTableSize for “how much data is my query tier serving,” and the Storage tab for “what is my total footprint, and how much of it is reclaimable.” A higher total does not mean the table grew — it means you can now see storage that was always there but previously invisible to the table size API (deep store, tiered storage, and orphaned data).What to do when Orphaned is high
The Storage tab and the API report the Orphaned total but never delete it. What to do depends on which of the three categories it is made of, so start by identifying the category rather than acting on the headline number.The Orphaned number bundles all three categories — unknown items, stale versions, and beyond-retention segments. The stat tooltip on the Storage tab shows which category dominates; for the individual item names, call the API with
verbose=2 and inspect the unexpected object before taking any action.Recommended workflow
- Rule out transient growth first. During and shortly after a rebalance, segment replacement, or heavy ingestion, storage legitimately exceeds the expected size because of overlapping placement and intermediate artifacts. Re-check after the operation settles, and across a couple of the controller’s periodic cycles, before treating anything as a real orphan.
- Identify the exact items and their category with
verbose=2. The remedy is driven entirely by category. - Apply the matching remedy:
Preventing recurrence
Most orphaned growth traces back to interrupted work. To keep it from returning:- Avoid stopping ingestion, rebalance, or segment-refresh operations mid-run.
- Right-size batch ingestion so failed uploads are rare; for External Tables, aim for larger source files.
- Monitor the Orphaned figure so growth is caught while it is small, rather than after it accumulates.
Glossary
Unknown items
Unknown items
Segments or files physically present on storage with no matching entry in Pinot (ZooKeeper) metadata — also called untracked or orphan segments. In the API these are
unexpected.unknownItems. In the Data Portal they contribute to both Orphaned (size) and Orphaned segments (count). Common causes: interrupted ingestion or rebalance, failed deep store uploads, and manually copied files.Stale versions
Stale versions
Older copies of a segment that is still part of the table, kept alongside the version currently in use in tiered/remote storage or in the server’s preload/metadata caches. A version string encodes the segment CRC and a hash of the table config and schema, so changing the schema or config, or re-indexing a segment, can produce a new expected version — but a segment holding only a single version on storage is never reported as stale, even when that version doesn’t match the expected one: the version string alone can’t tell a legitimate reused version (for example, a new index added without rebuilding the segment) apart from a real leftover, so the lone version is assumed to be the one in use. Only once more than one version is present for a segment are versions reported: any version matching the expected one is in use, and if none matches, the newest version (by CRC/config-hash recency) is assumed in use and the older ones are reported stale. Reported in
totalStaleVersions and unexpected.staleVersions; their bytes count toward Orphaned but not toward Orphaned segments.Beyond-retention segments
Beyond-retention segments
Deleted segments that remain in the deep store
Deleted_Segments area past their retention deadline. The deadline comes from the __RETENTION_UNTIL__<yyyyMMddHHmm> suffix on the file name, or, if absent, from the last-modified time plus the configured deleted-segment retention. Reported in unexpected.beyondRetentionSegments. A persistent non-zero count usually means the retention/cleanup job is not running.Online segments
Online segments
Live segments that belong to the table, stored in the deep store under
<data.dir>/<tableNameWithType>. These make up the bulk of expected deep store size.Deleted segments
Deleted segments
Segments moved to the deep store retention queue at
<data.dir>/Deleted_Segments/<rawTableName>. Those within retention are expected; those past retention are counted as beyond-retention (orphaned).Upsert / dedup snapshots
Upsert / dedup snapshots
Snapshot files written by upsert- or dedup-enabled tables, stored in the deep store. Always reported as expected (never counted as orphaned).
Preload index & metadata cache
Preload index & metadata cache
Server-local caches used by tiered storage and External Tables, all part of the same persistent disk cache (see Persistent disk cache). The preload index stages remote-tier segment indexes for low-latency serving; the metadata cache holds cached metadata for remote-tier segments; the LFU mmap cache holds admitted index buffers. These three are keyed by segment version, so all are checked for stale versions. The deletion-vector Puffin cache is also included in this location’s size total, but it has no segment/version mapping, so it never contributes to stale-version or unknown-item counts.
Segment size stats (p50 / p90 / p99 / avg)
Segment size stats (p50 / p90 / p99 / avg)
Percentile and average segment sizes computed over the table’s expected segments. Returned per server (
segmentSizeStats) and aggregated across all servers (serverAggregateSegmentSizeStats). A large gap between p50 and p90/p99 indicates size skew.Using the storage usage API
The Storage tab is powered by a controller endpoint. Most users never need to call it directly. Reach for the API when you want to script storage checks, feed a dashboard, or drill into the specific orphaned or stale items behind the aggregate numbers — the Data Portal shows the totals but not the individual item names. The endpoint provides a consolidated view for a table across server instances, deep store, and the remote object store, aggregating results collected from each server.tableName— table name with type, for examplemyTable_OFFLINEormyTable_REALTIME.verbose— verbosity level (integer, default0):
The size and count invariants below always hold (and are enforced by integration tests):
staleVersions appears in the size total but not in the item count — this is exactly why a location can report non-zero Orphaned bytes with zero Orphaned segments. Stale versions are counted separately in totalStaleVersions.
Response: summary (verbose=0)
Per-location scalar totals plus segment size statistics. breakdown is omitted.
Example response
Example response
Response: full breakdown (verbose=2)
verbose=1 adds a breakdown for each area but omits the unexpected item lists. verbose=2 additionally lists the individual unexpected contributors — unknown items, stale versions, and beyond-retention segments.
Example response
Example response
Response schema
The response is hierarchical. It is defined below in three parts:- Root response fields
- The StorageStats object (reused recursively)
- Breakdown definitions (per-location keys)
1. Root response fields
2. The StorageStats object
This structure is used for serverInstances, deepStore, remoteS3, and every nested breakdown object.
A remote-tier crawl can fail on a very large External Table (millions of objects under the tier prefix) — the controller now reports the tier as failed via
error instead of silently returning zeros for it. The Data Portal’s Tiered Storage card does not yet distinguish this from a genuinely empty tier; use the API directly (or retry) if a tier unexpectedly shows all zeros.Segment size stats
Returned asserverAggregateSegmentSizeStats at the root and as segmentSizeStats per server instance. Computed over the table’s expected segments.
The unexpected object
Each entry is an object with
count (integer), sizeInBytes (long), and items (array of segment/version names). The items array is populated only at verbose=2.
3. Breakdown definitions
The keys inside abreakdown object depend on the location.
Server instance (serverInstances):
Deep store (
deepStore):
Remote / tiered store (
remoteS3):