What you will accomplish in this tutorial
- Adding a sample dataset to ThirdEye
- Creating an alert on a metric in the sample dataset
- Configuring anomaly notifications
- Viewing an anomaly
- Performing a root cause analysis
Prerequisites
To start, contact StarTree for details on getting ThirdEye.Bringing your data into ThirdEye
When you access ThirdEye for the first time, you’ll be taken to a welcome screen. This welcome flow will walk you through the two primary steps to get you started with Thirdeye. The first step is to connect your data source and onboard your datasets to ThirdEye. On the first screen select StarTree Cloud, as we’ll onboard a dataset from the Apache Pinot database from the trial. Next, select the ‘eCommerce Website PageViews’ dataset under the Sample Datasets section. ThirdEye will add this dataset to the StarTree Cloud Apache Pinot database for you. The dataset is a sample dataset of an ecommerce company that is recording versions and views of its checkout page. This is a key metric for the ecommerce company that uses this as a marker to track sales and revenue of the business.Creating your alert
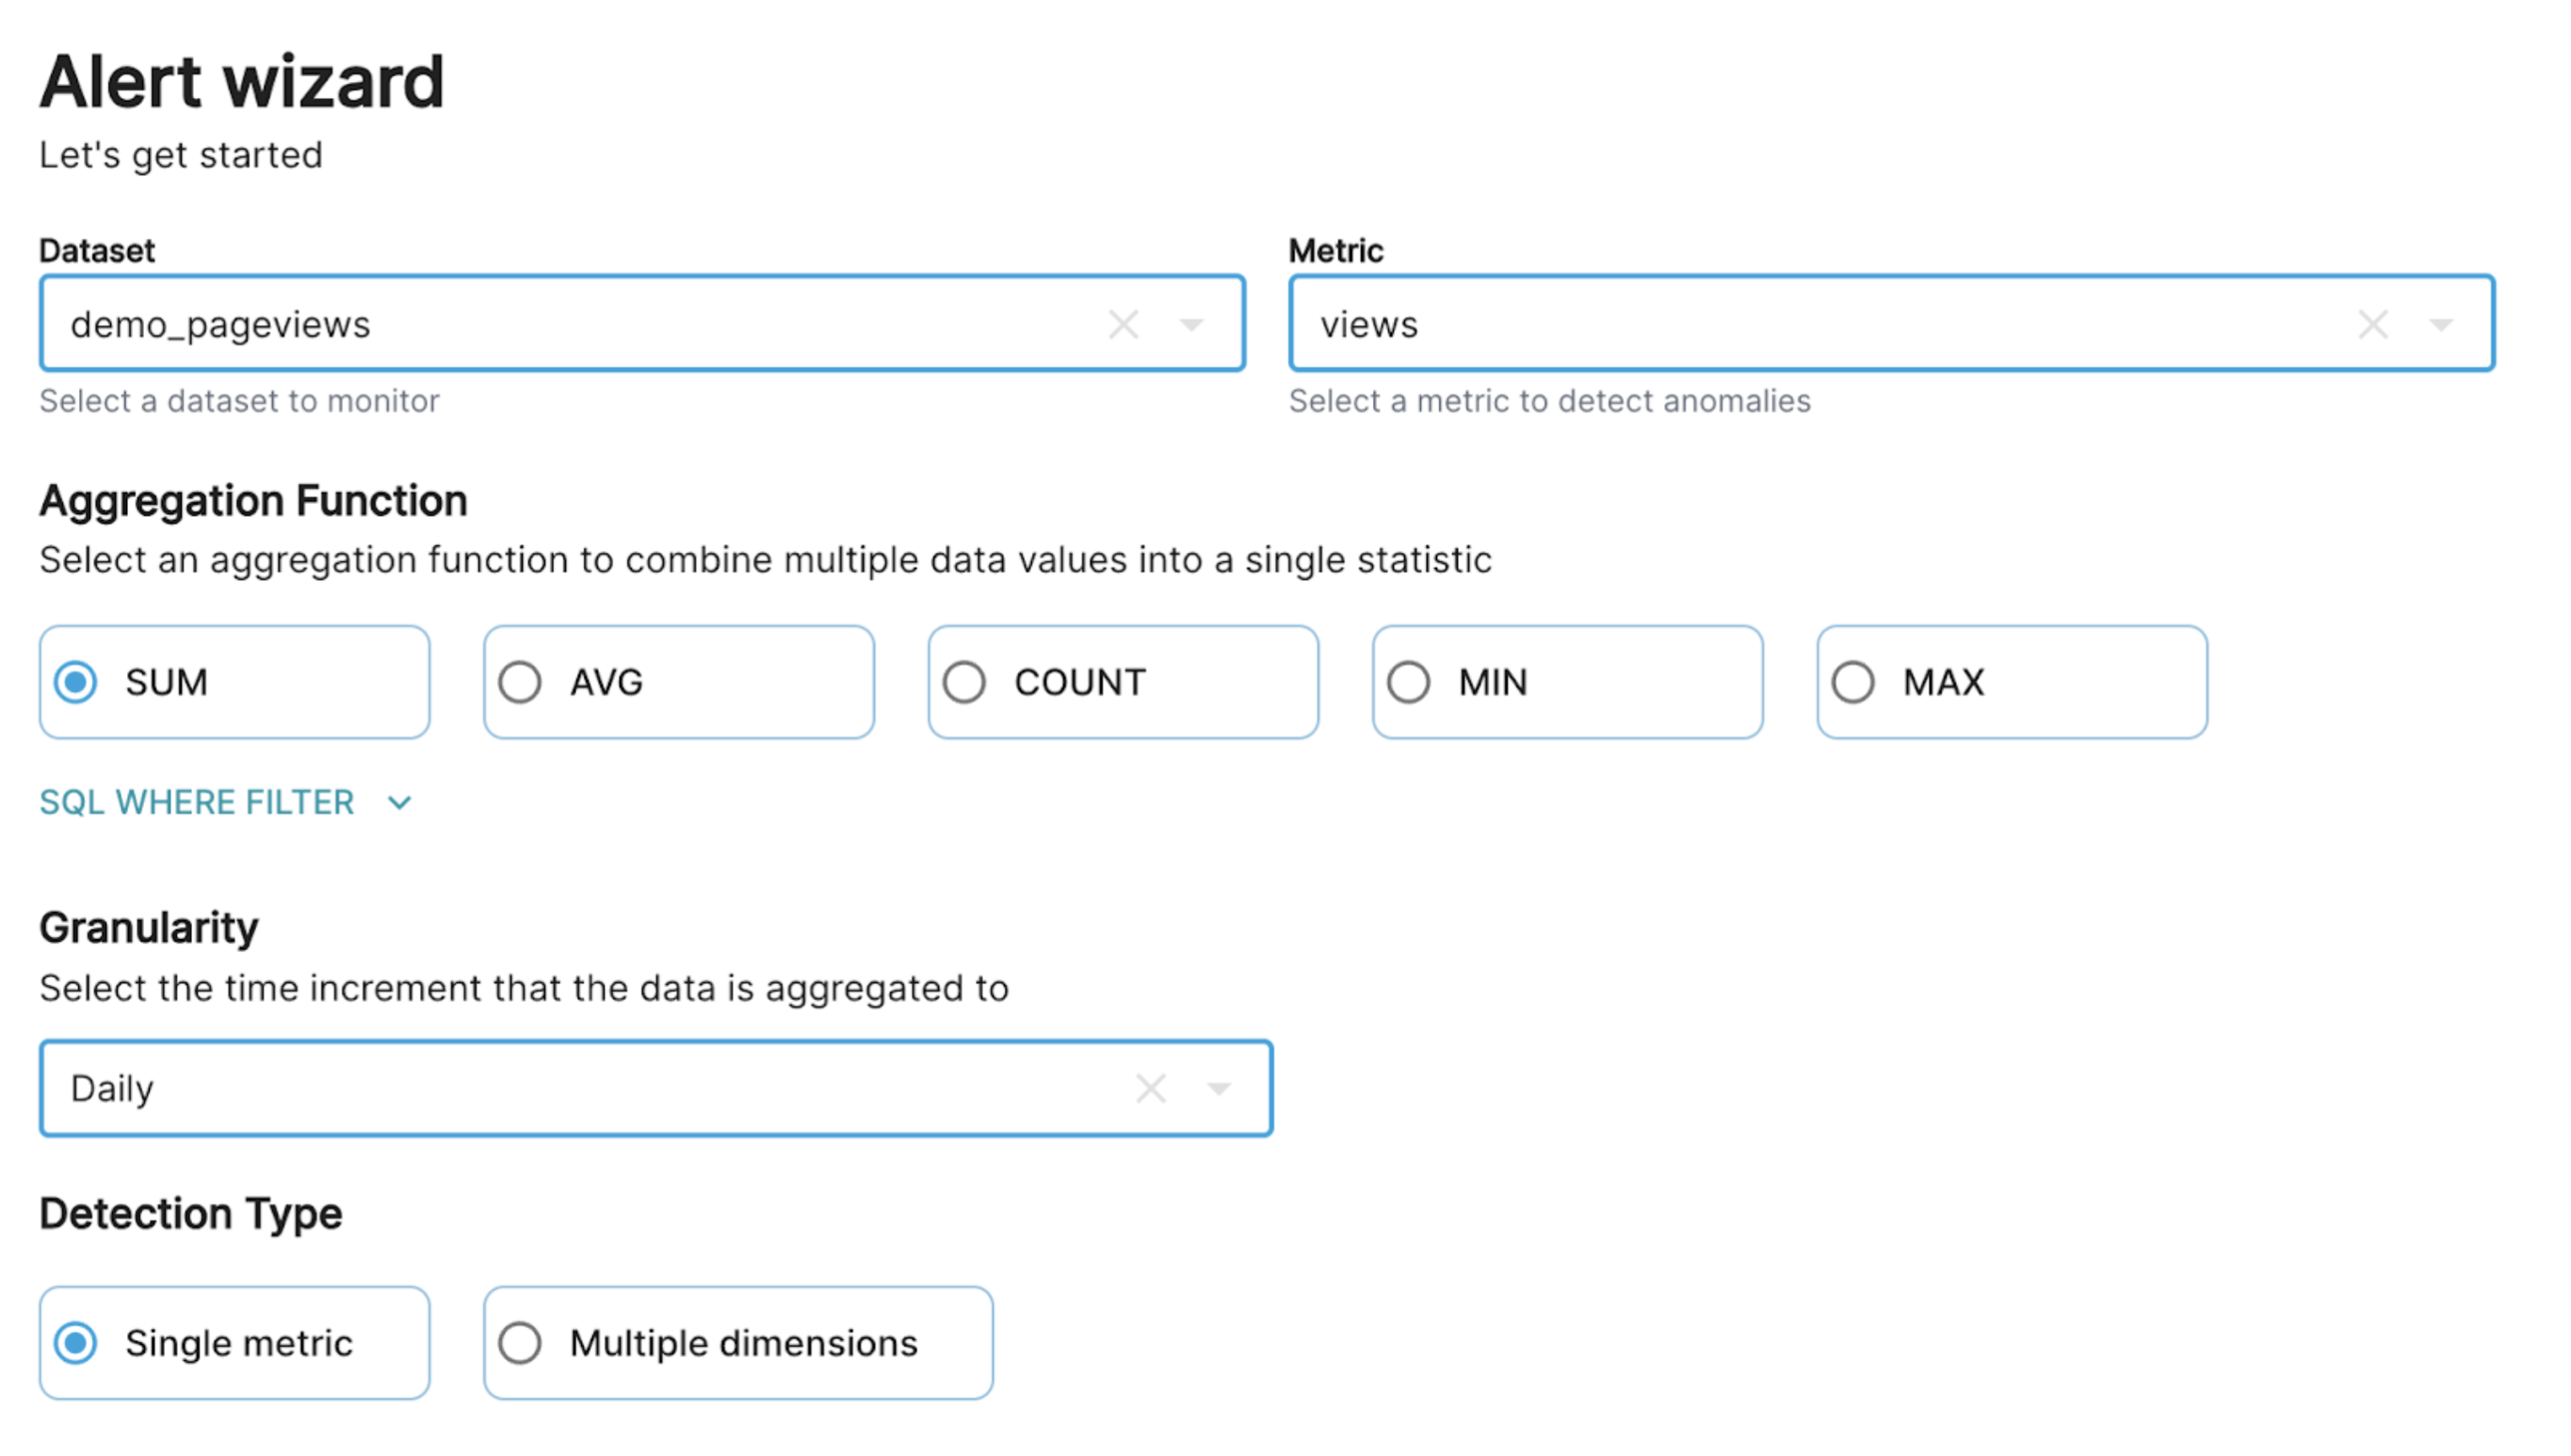
Next after onboarding your dataset, select the second step to create your first alert. You’re taken to an alert wizard that will guide you through the steps to create an alert.What is an alert?
Alerts are the rules you build to detect anomalies in your metrics. ThirdEye gives you a variety of templates and algorithms to model your metric and its patterns. When the metric falls out of the range of the model you select, ThirdEye alerts you of the anomaly.
Alerts are the rules you build to detect anomalies in your metrics. ThirdEye gives you a variety of templates and algorithms to model your metric and its patterns. When the metric falls out of the range of the model you select, ThirdEye alerts you of the anomaly.
What is a metric?In Startree ThirdEye, a Metric refers to a column in your dataset or a statistic derived from the data that is tracked within ThirdEye.
In this context, a Metric is typically a specific measure or KPI (Key Performance Indicator) that is important for monitoring the health
and performance of your business. For example, a Metric could represent things like:
- Business KPIs (e.g., revenue, transaction volume)
- App Behaviors (e.g. log-ins, errors)
- Cloud spend
- Networking traffic
SUM as the aggregation function, and select daily granularity. For this alert and the options
we set so far, ThirdEye will sum the views coming into the table every day.
Selecting your detection algorithm
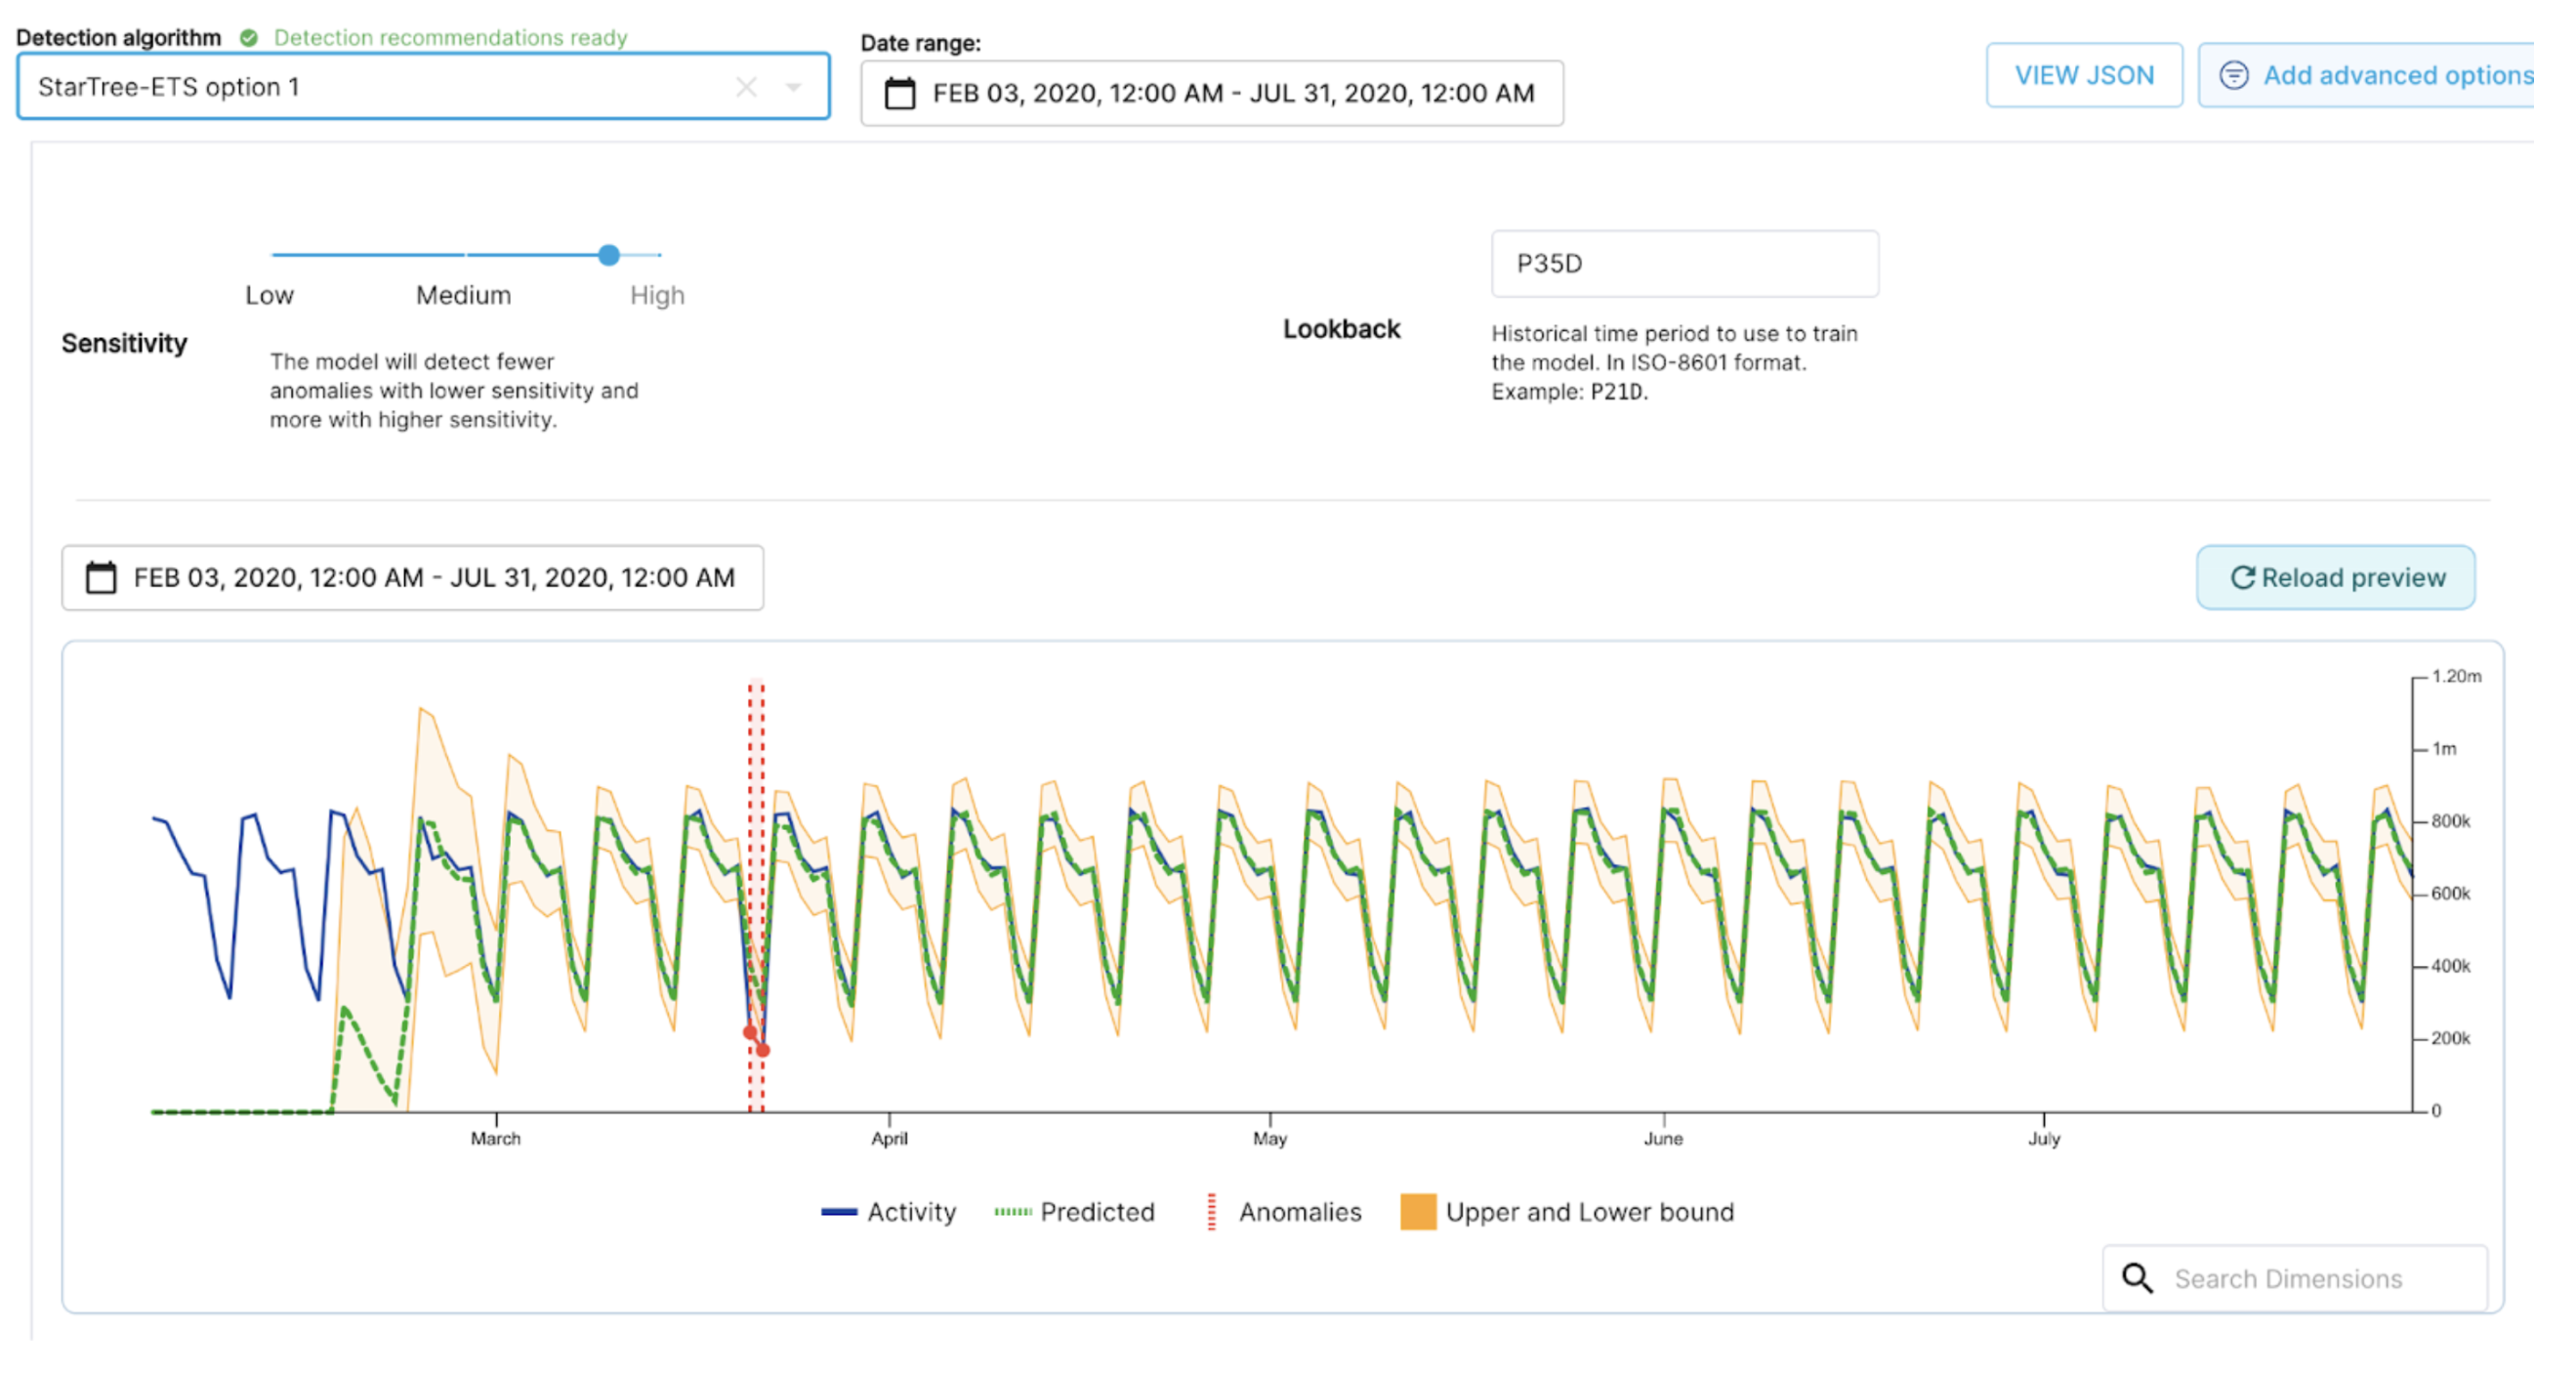
Next, we need to select the model that will fit the views data in order to detect anomalies. Luckily we have a Detection Algorithm Recommender that will search through and fit all the possible algorithms ThirdEye offers to find the best one.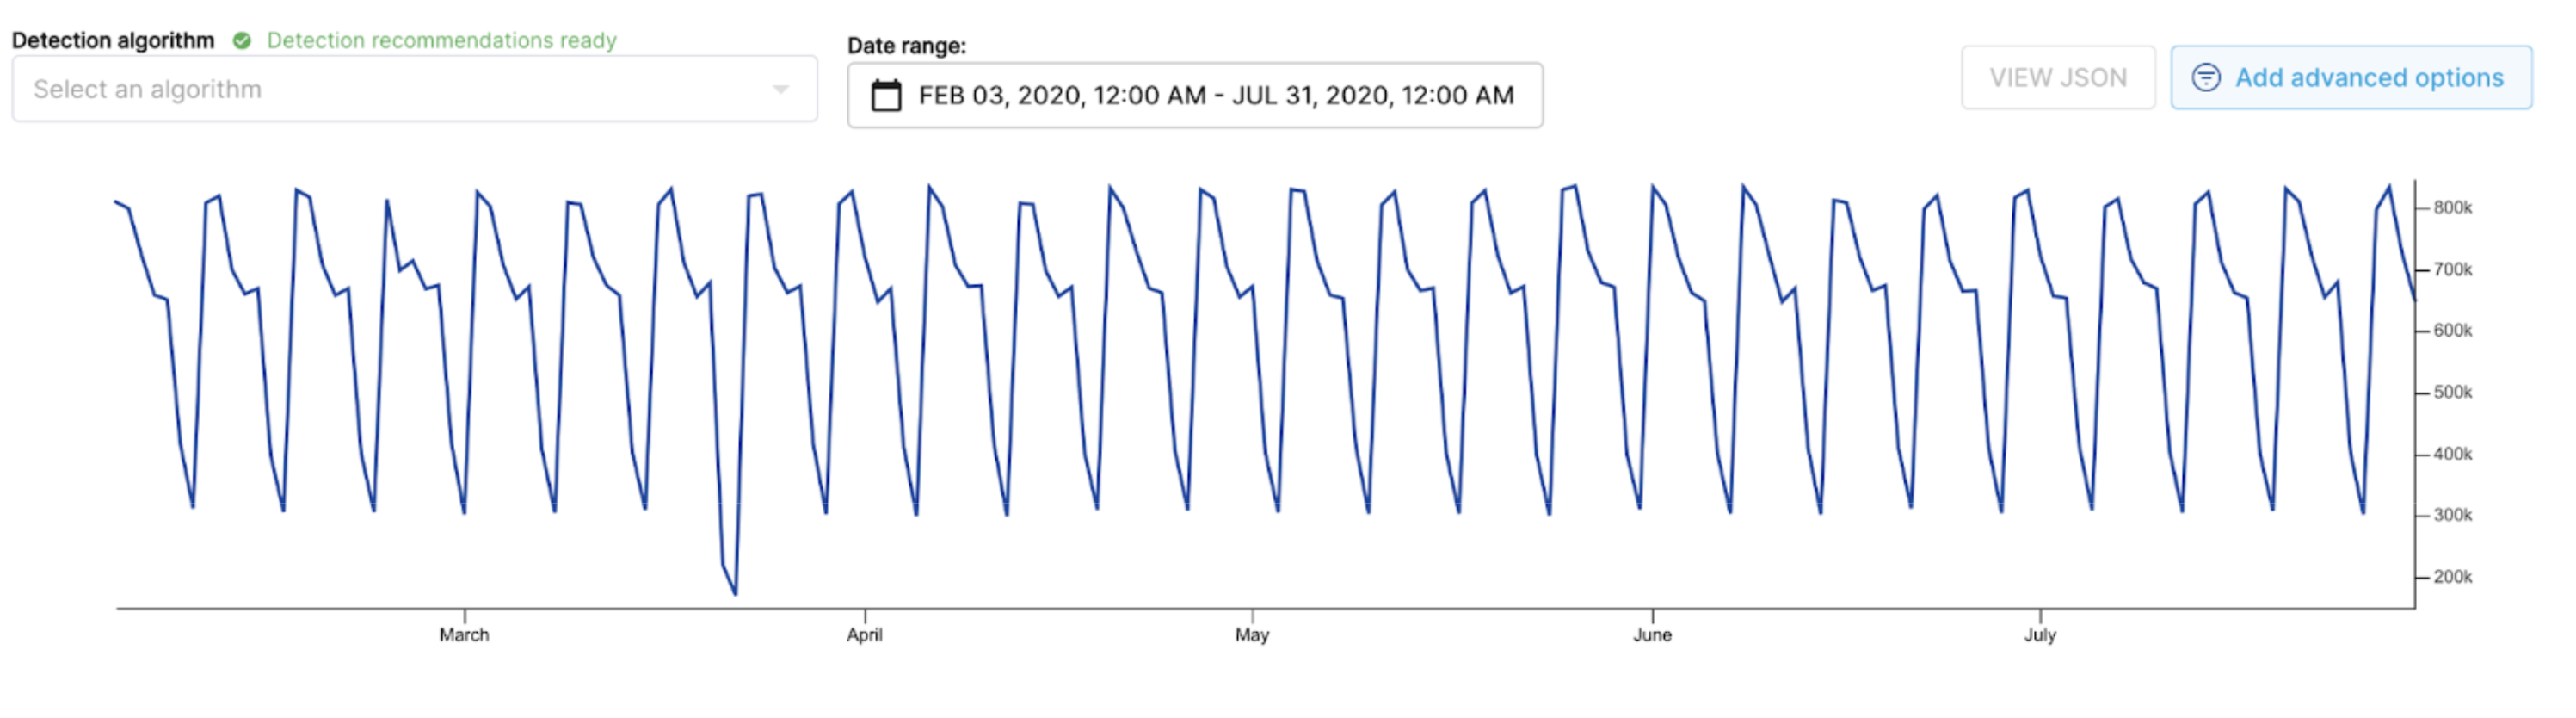
Configure Notifications
When an anomaly shows up in your dataset, it’s important to be notified when it happens. Let’s set up a notification group – which we can use to configure ThirdEye to send notifications when anomalies happen. Click on the toggle button to configure notifications, and select ‘Create a new notification group for this alert’. Let’s set up email notifications for the anomalies that occur. Fill out the form with a subscription group name and your email address that you want alerts to go to. By default, only new anomalies will be notified, but since this is a sample dataset from 2020 we will enable ‘Notify Historical Anomalies’ to receive the notifications for this dataset. For now let’s leave the other fields at their default values.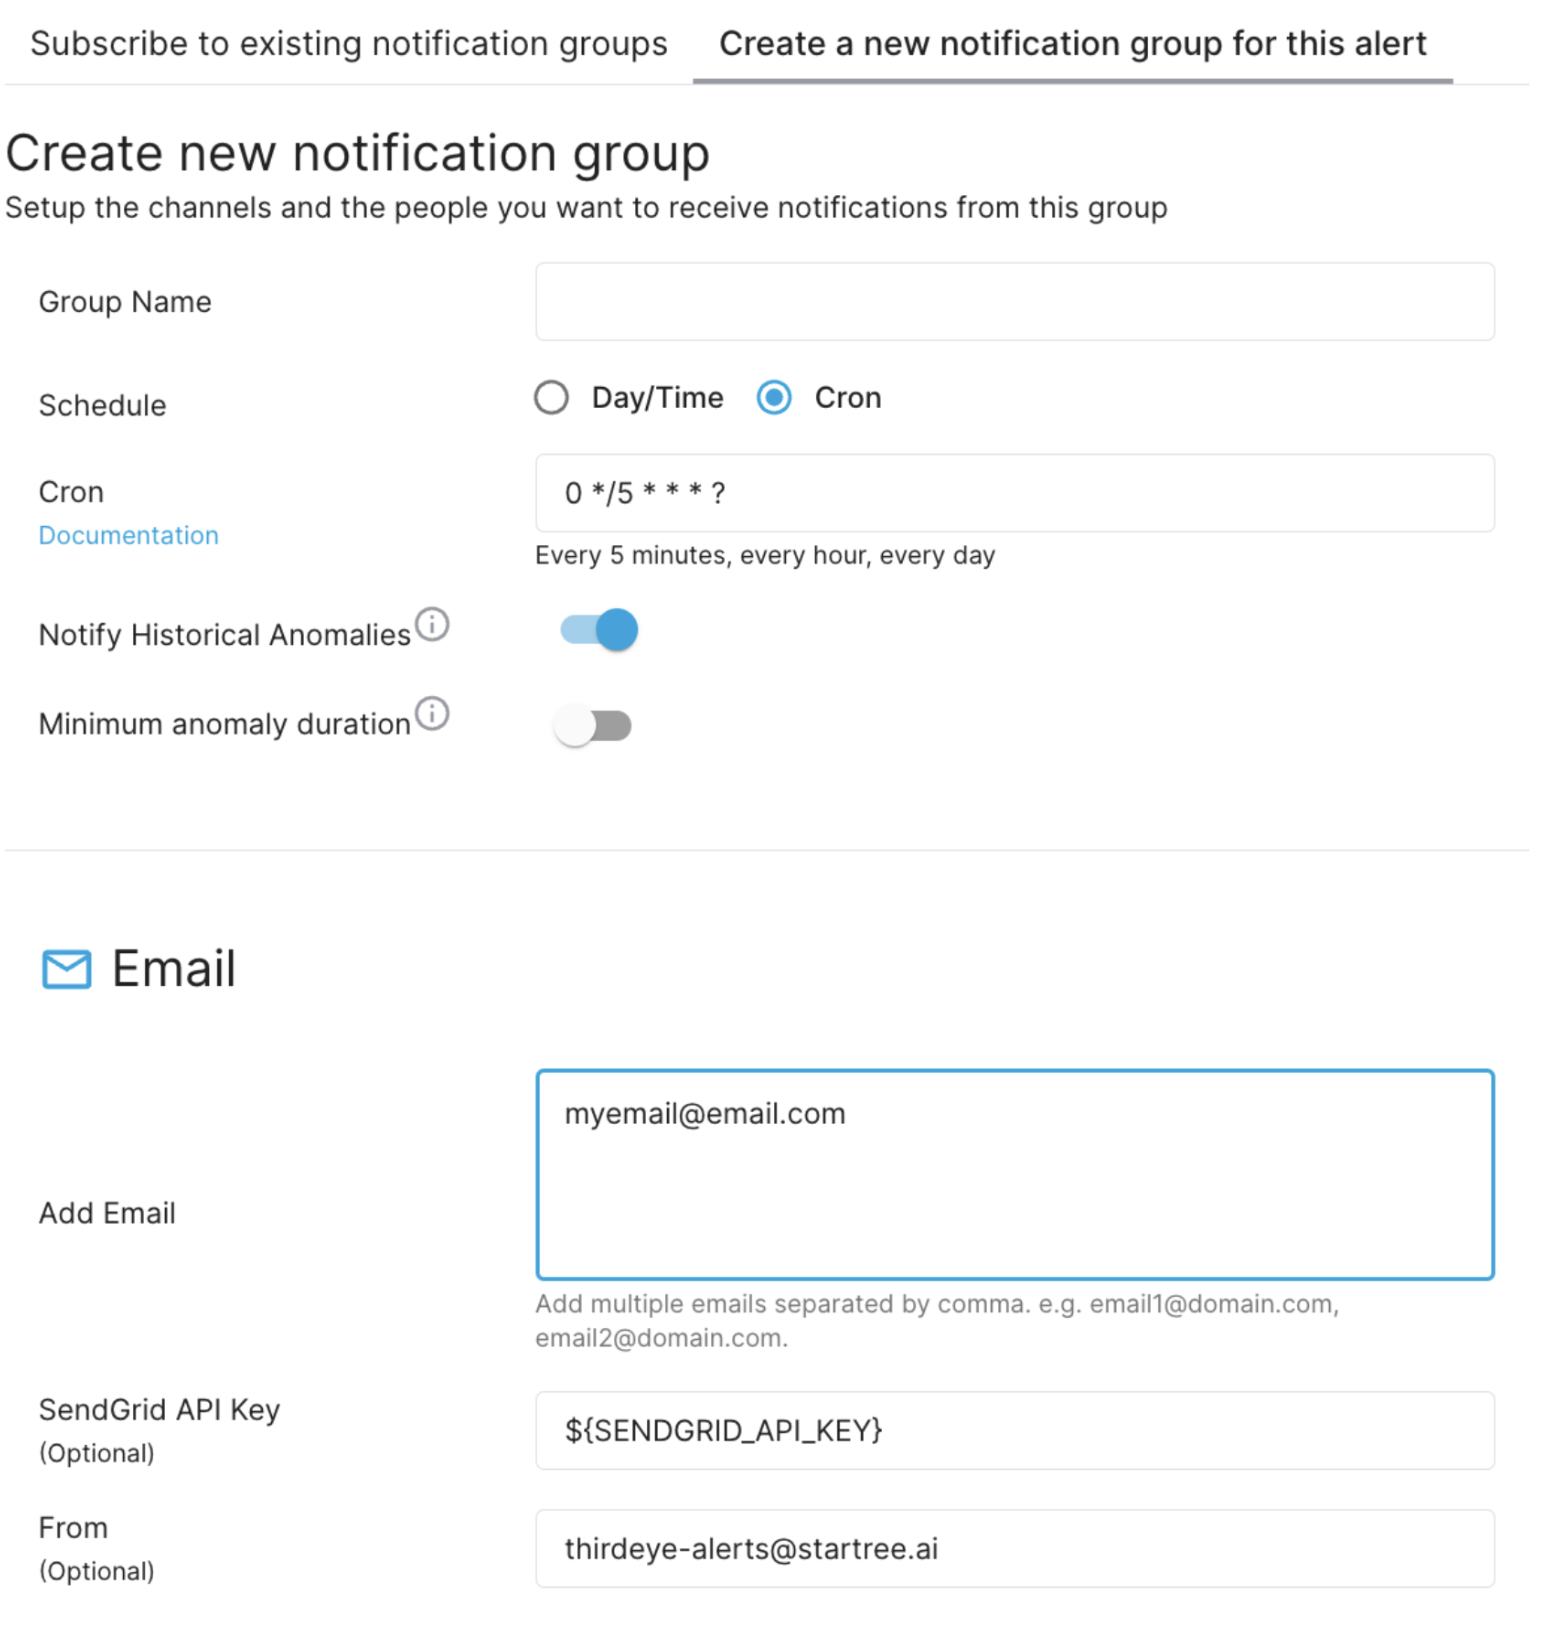
Finish creating your alert
Click ‘Create Alert’, and on the modal, name your alert and keep the default schedule settings. These schedule settings means that ThirdEye will run the detection on the previous day’s data at 5 AM every day to report the anomalies that appeared. Let’s leave the default as is.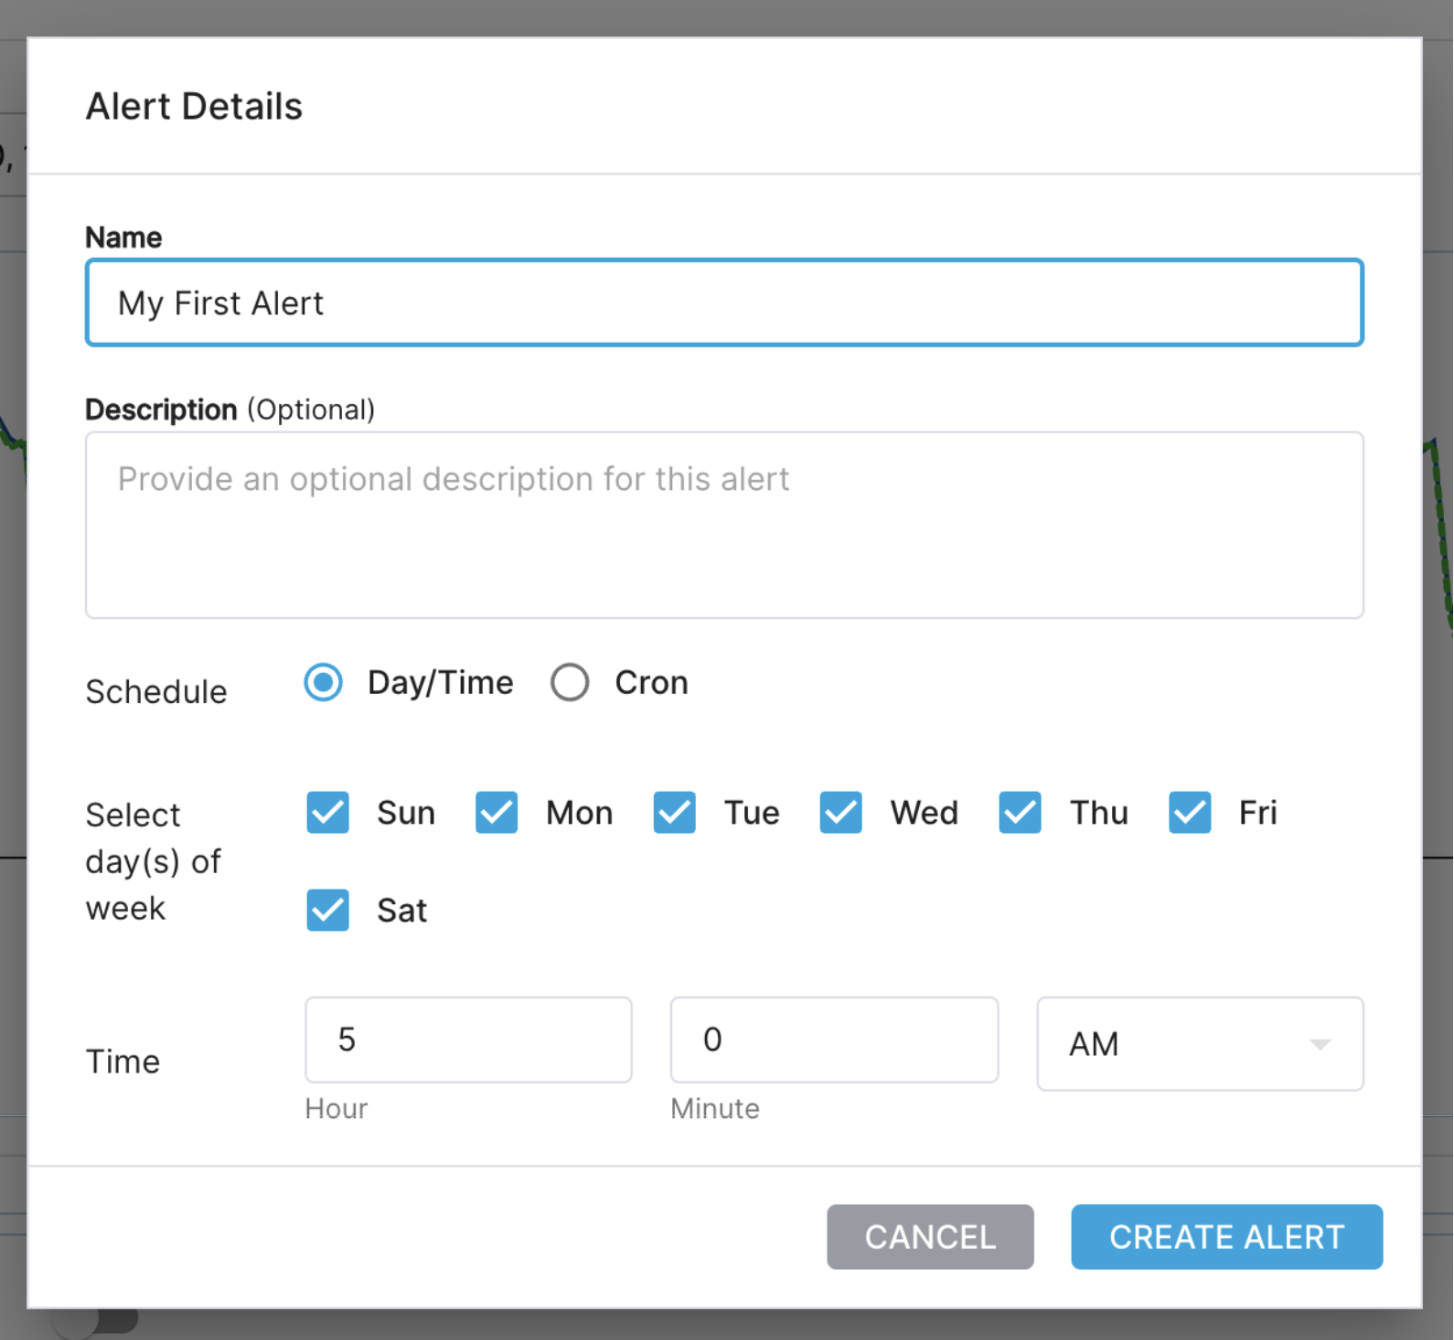
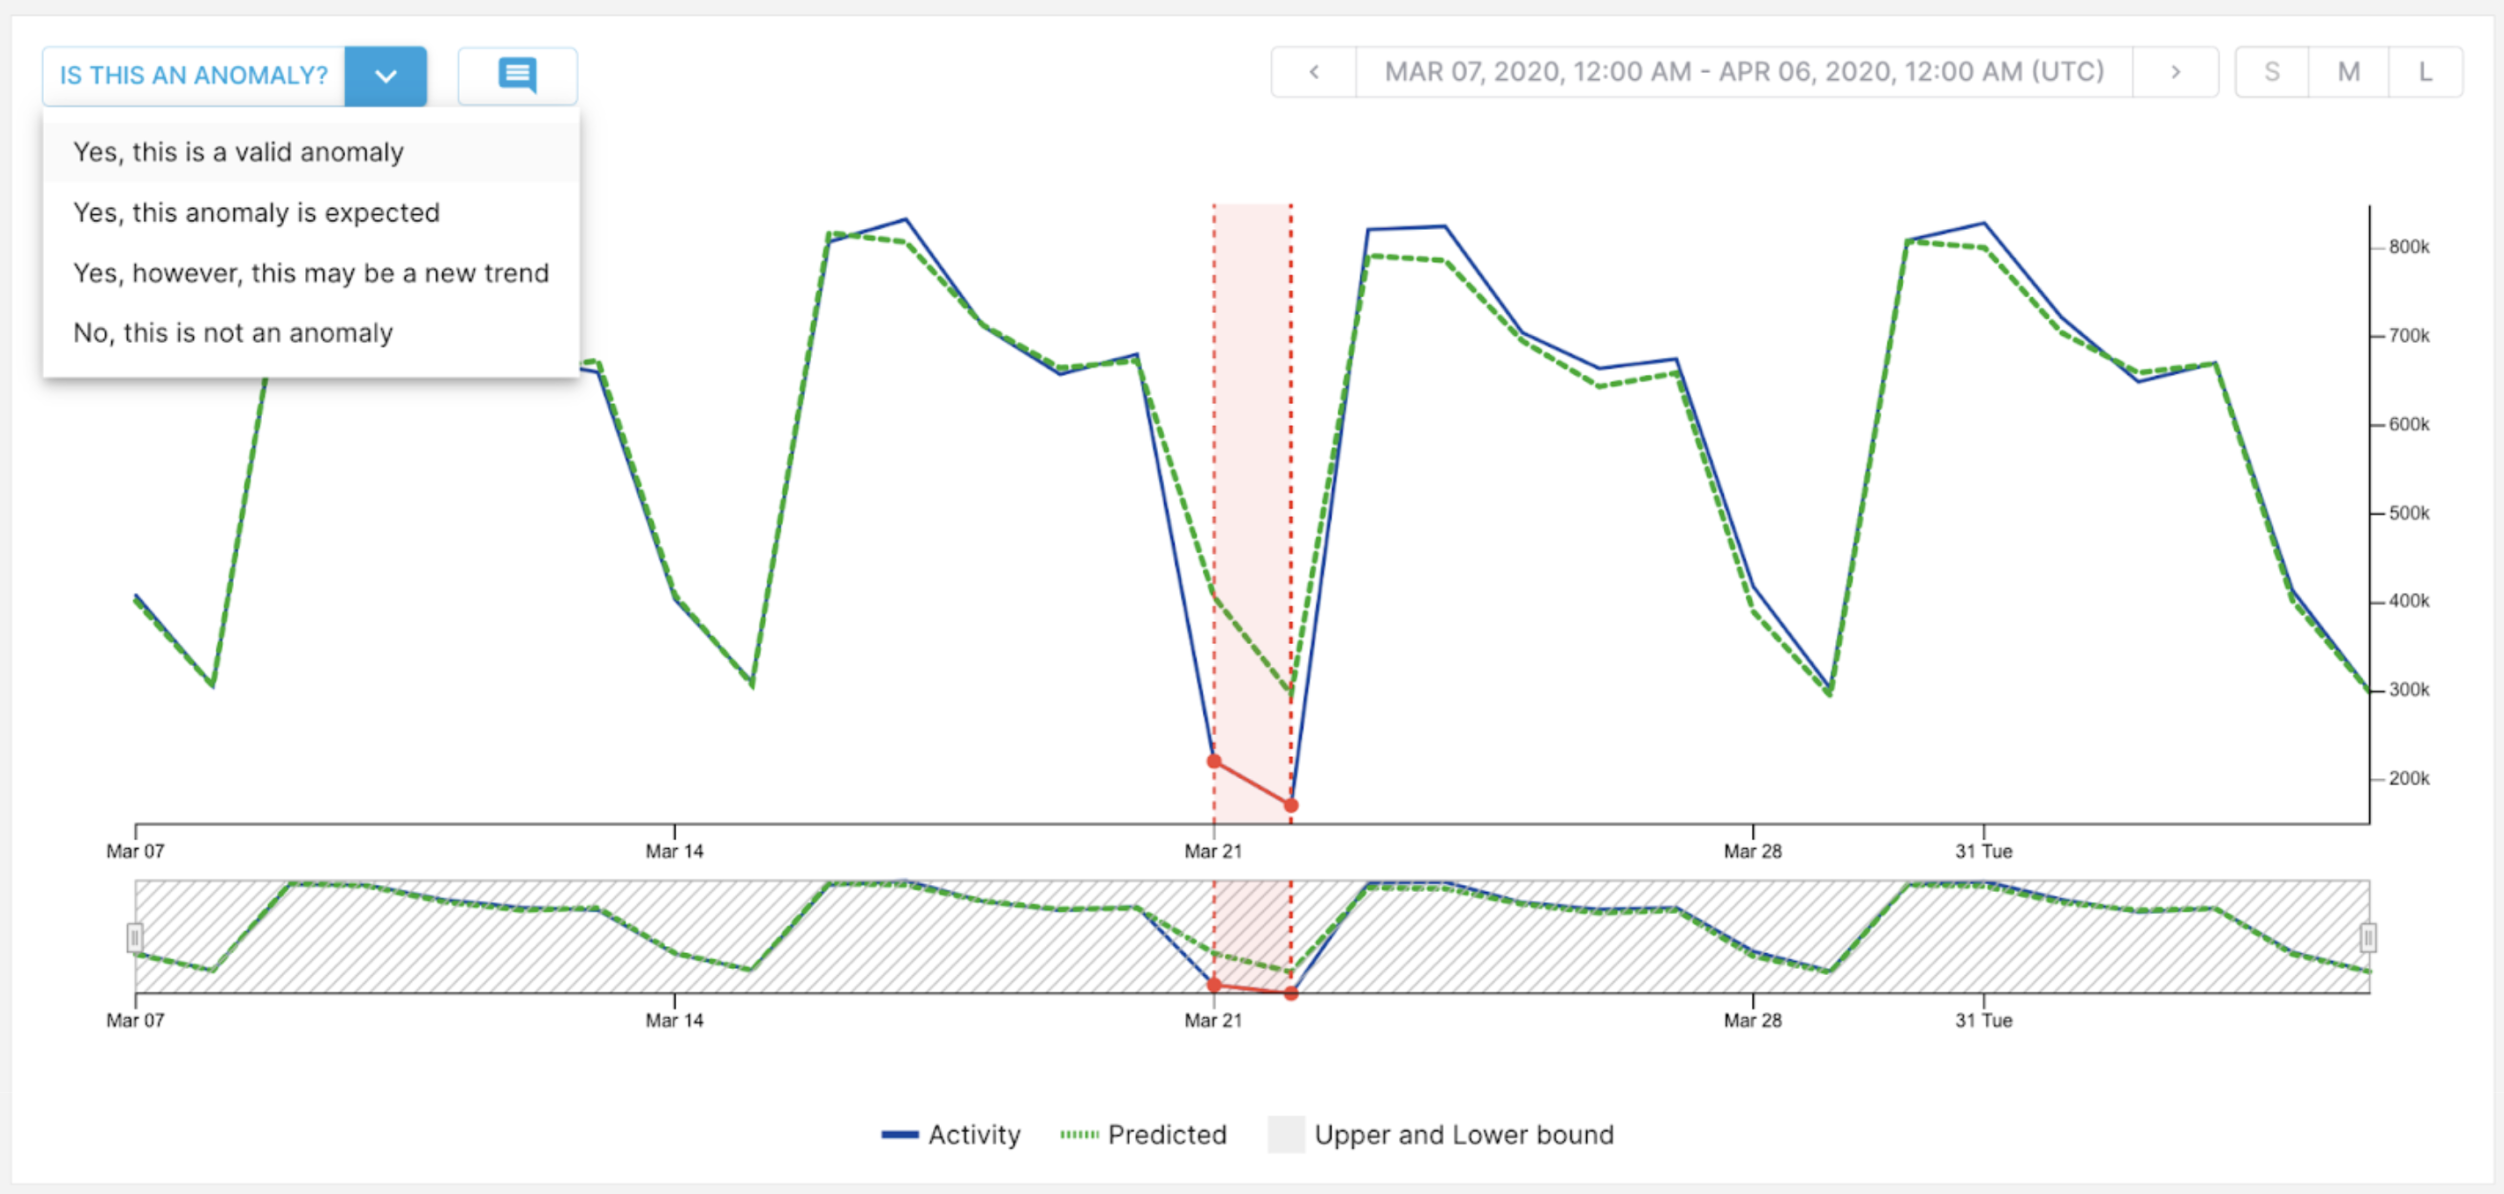
Viewing your anomalies
After creating your alert, you’re taken to the Alert page. The page will update automatically with the anomalies you saw on the Alert Creation screen. When the page updates, click on the latest anomaly. This is the red point lower and further right than the other.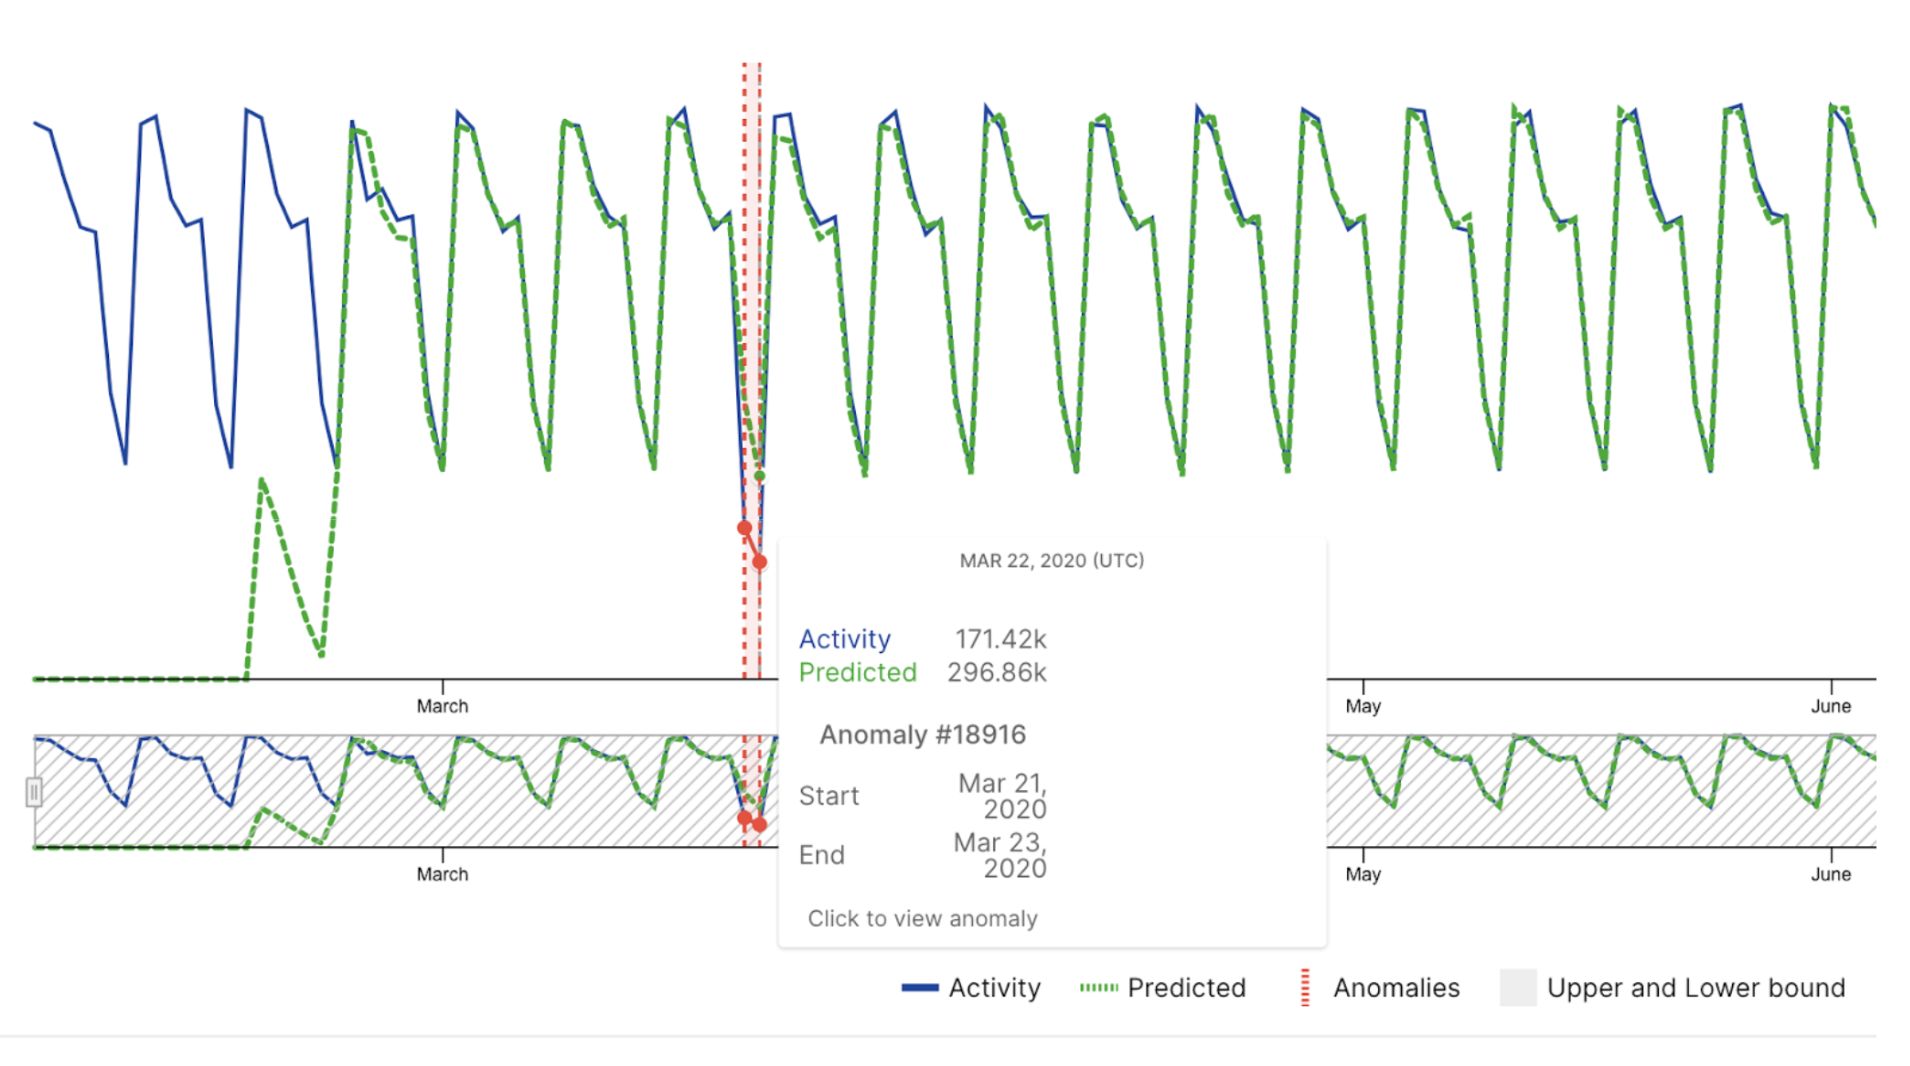
What is root cause analysis?
Root cause analysis in anomaly detection aims to identify the underlying factor(s) responsible for unusual patterns or behavior in data. It goes beyond simply flagging anomalies and seeks to pinpoint why those anomalies occurred, guiding future corrective actions or system improvements.
Root cause analysis in anomaly detection aims to identify the underlying factor(s) responsible for unusual patterns or behavior in data. It goes beyond simply flagging anomalies and seeks to pinpoint why those anomalies occurred, guiding future corrective actions or system improvements.
Perform a root cause analysis
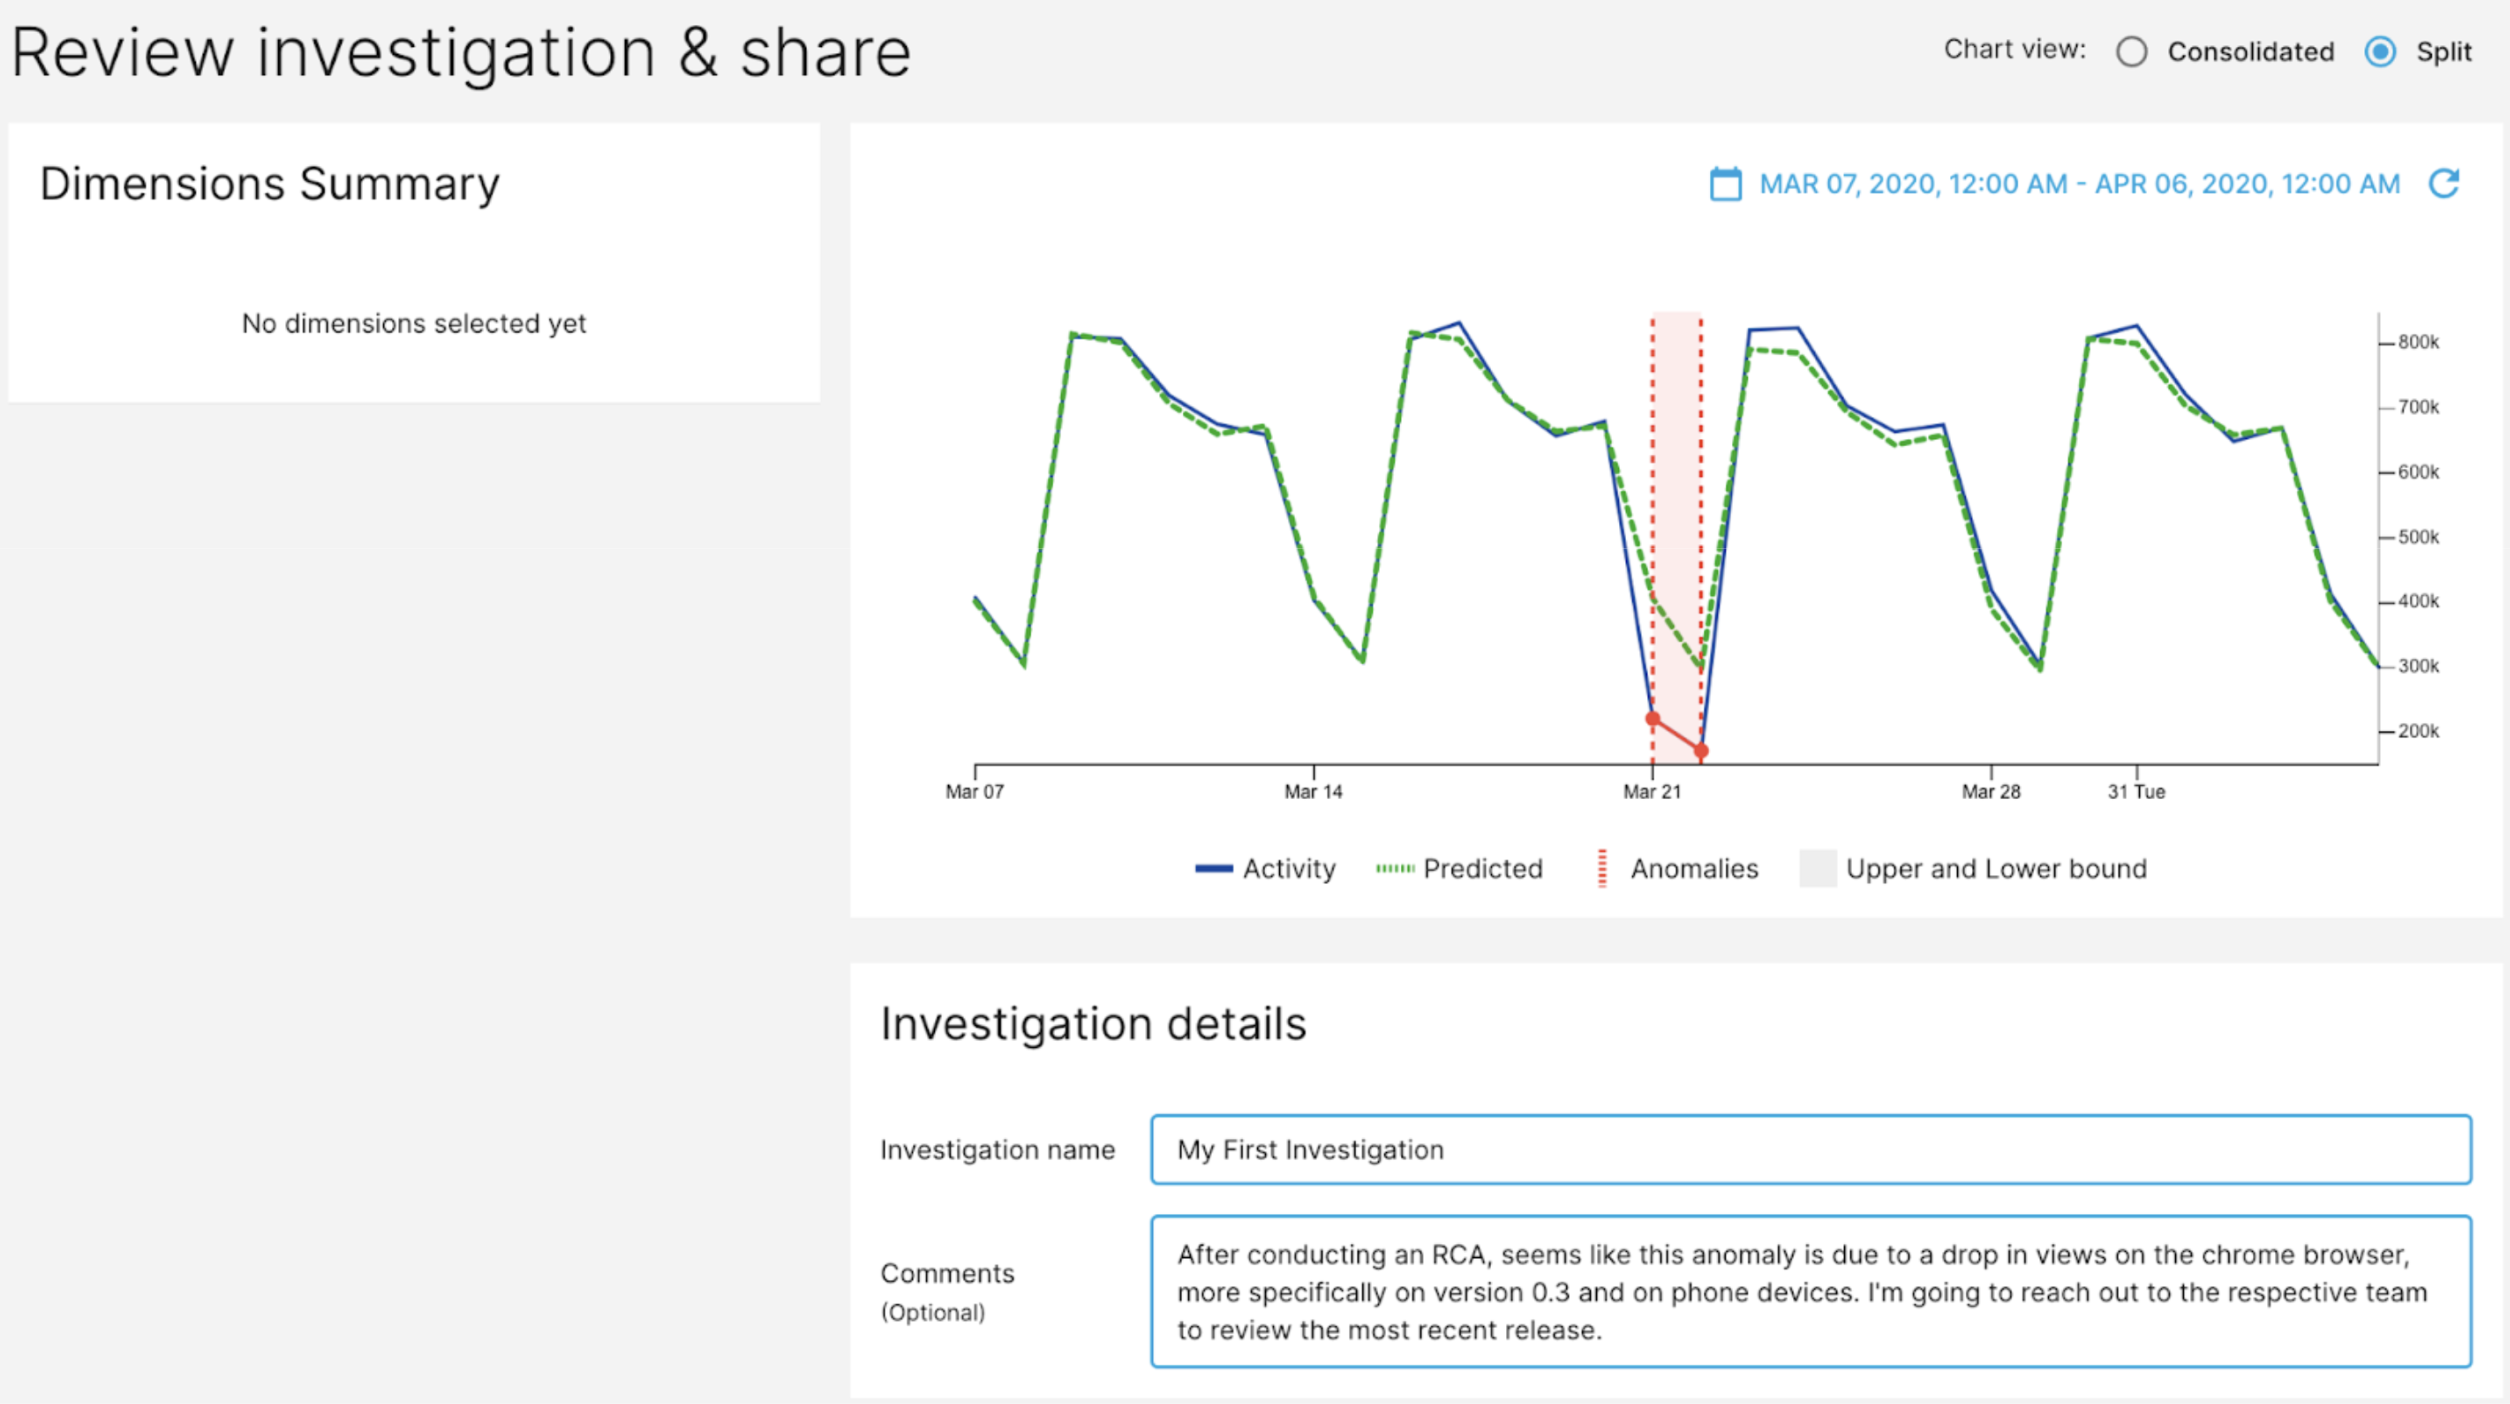
After selecting to investigate the anomaly, you should be taken to an Investigation page to perform a RCA on the anomaly. You should see a page like the one below: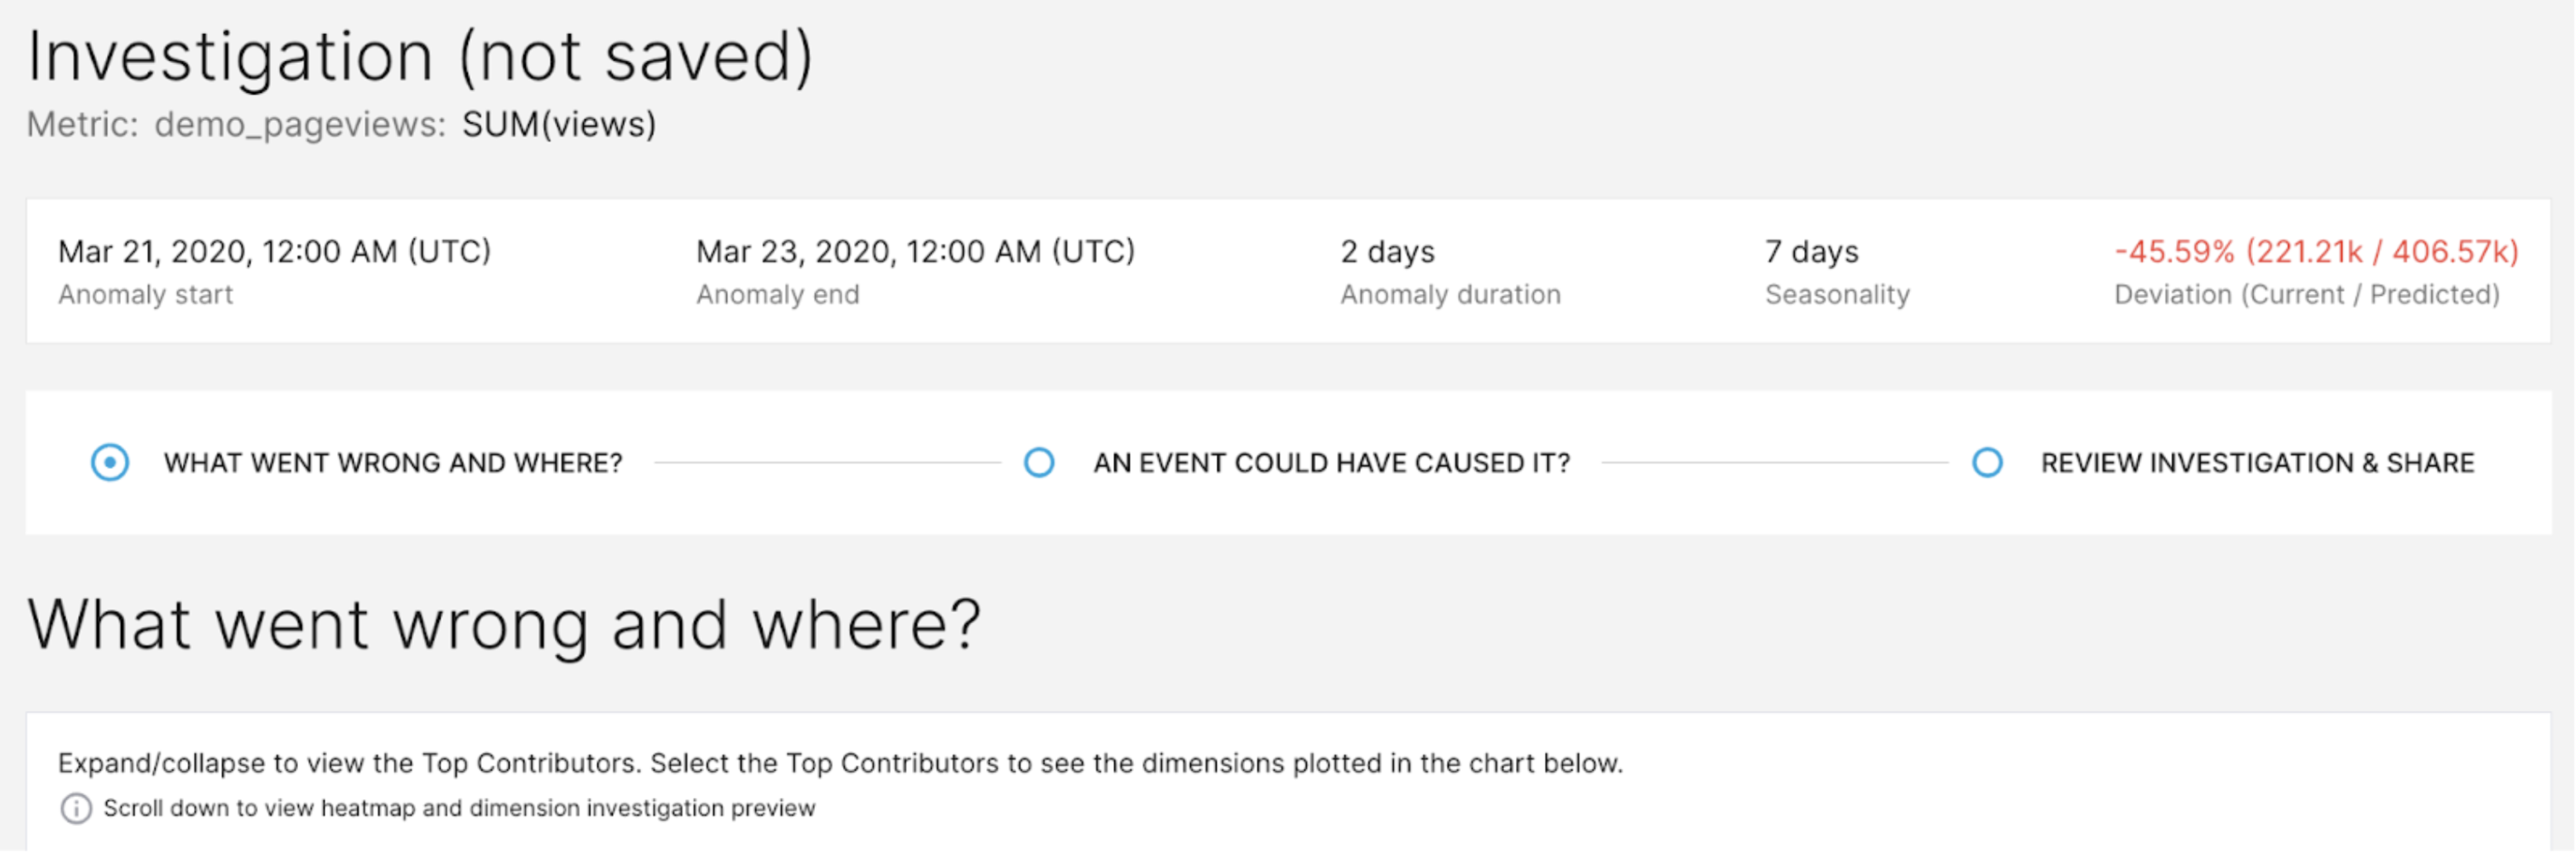

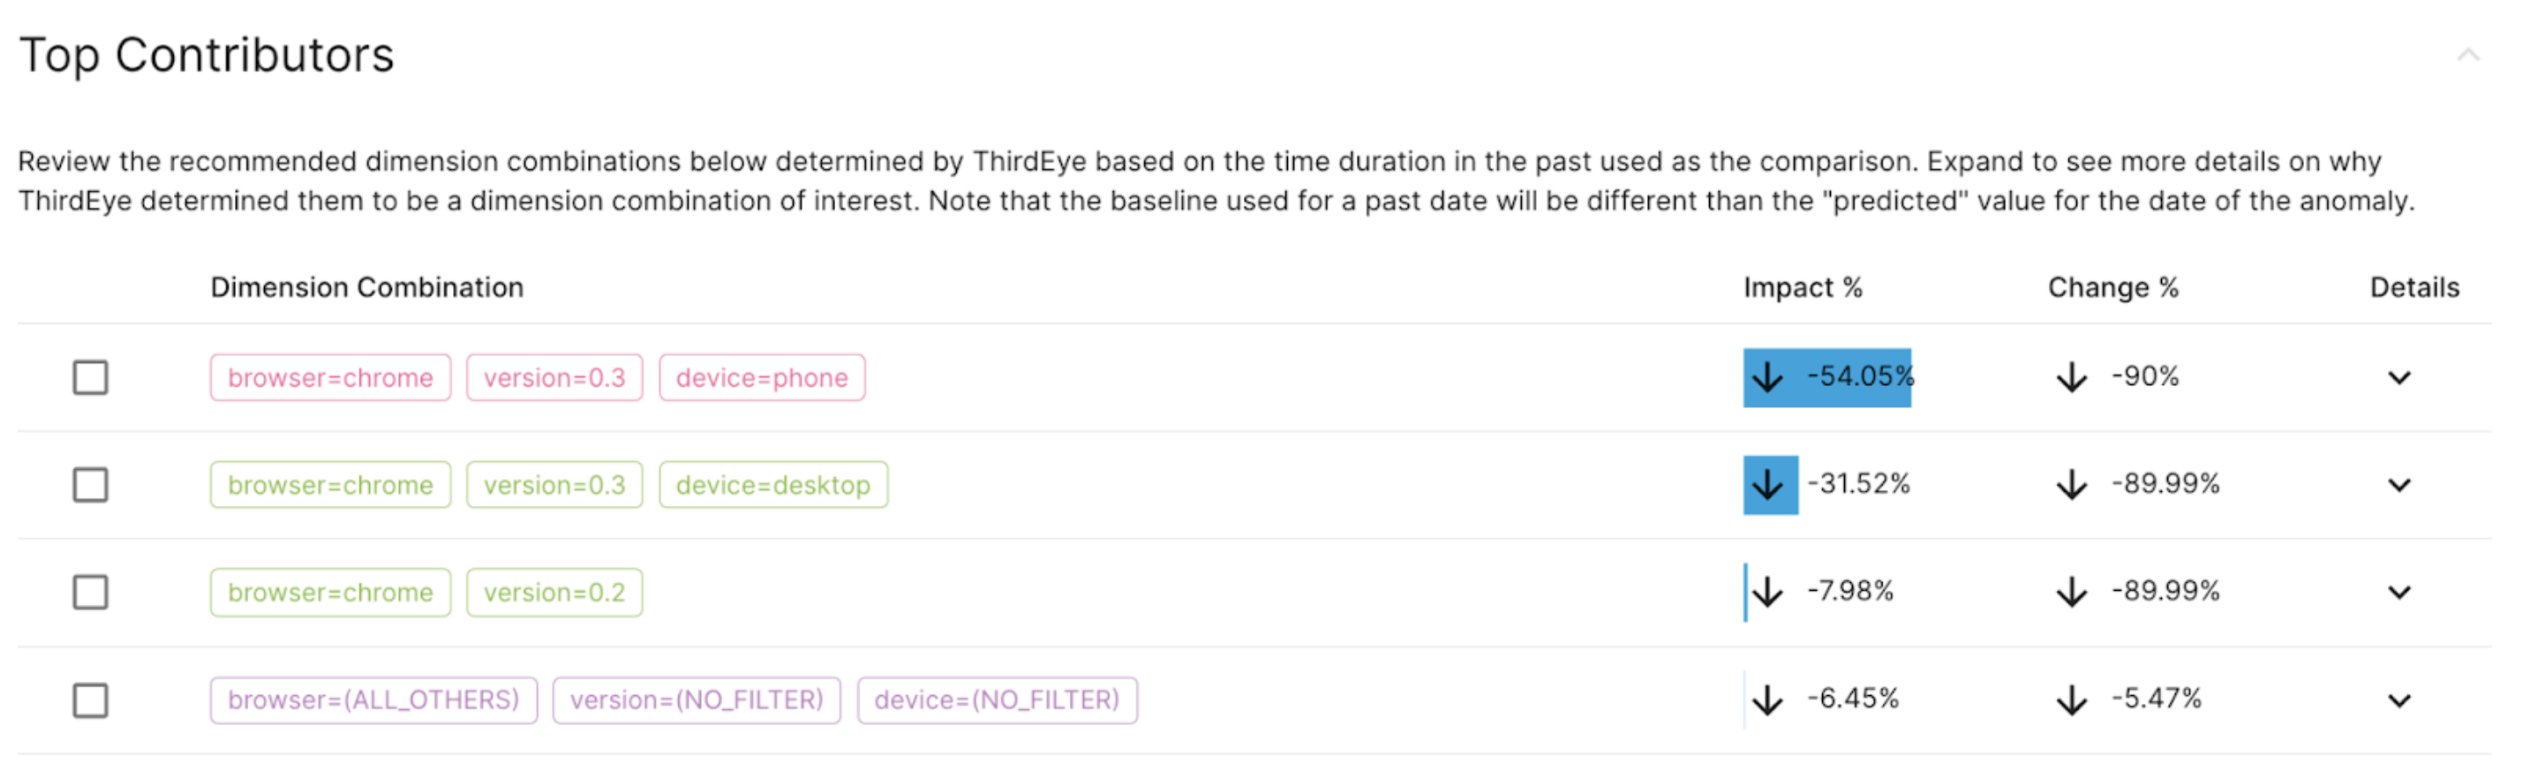
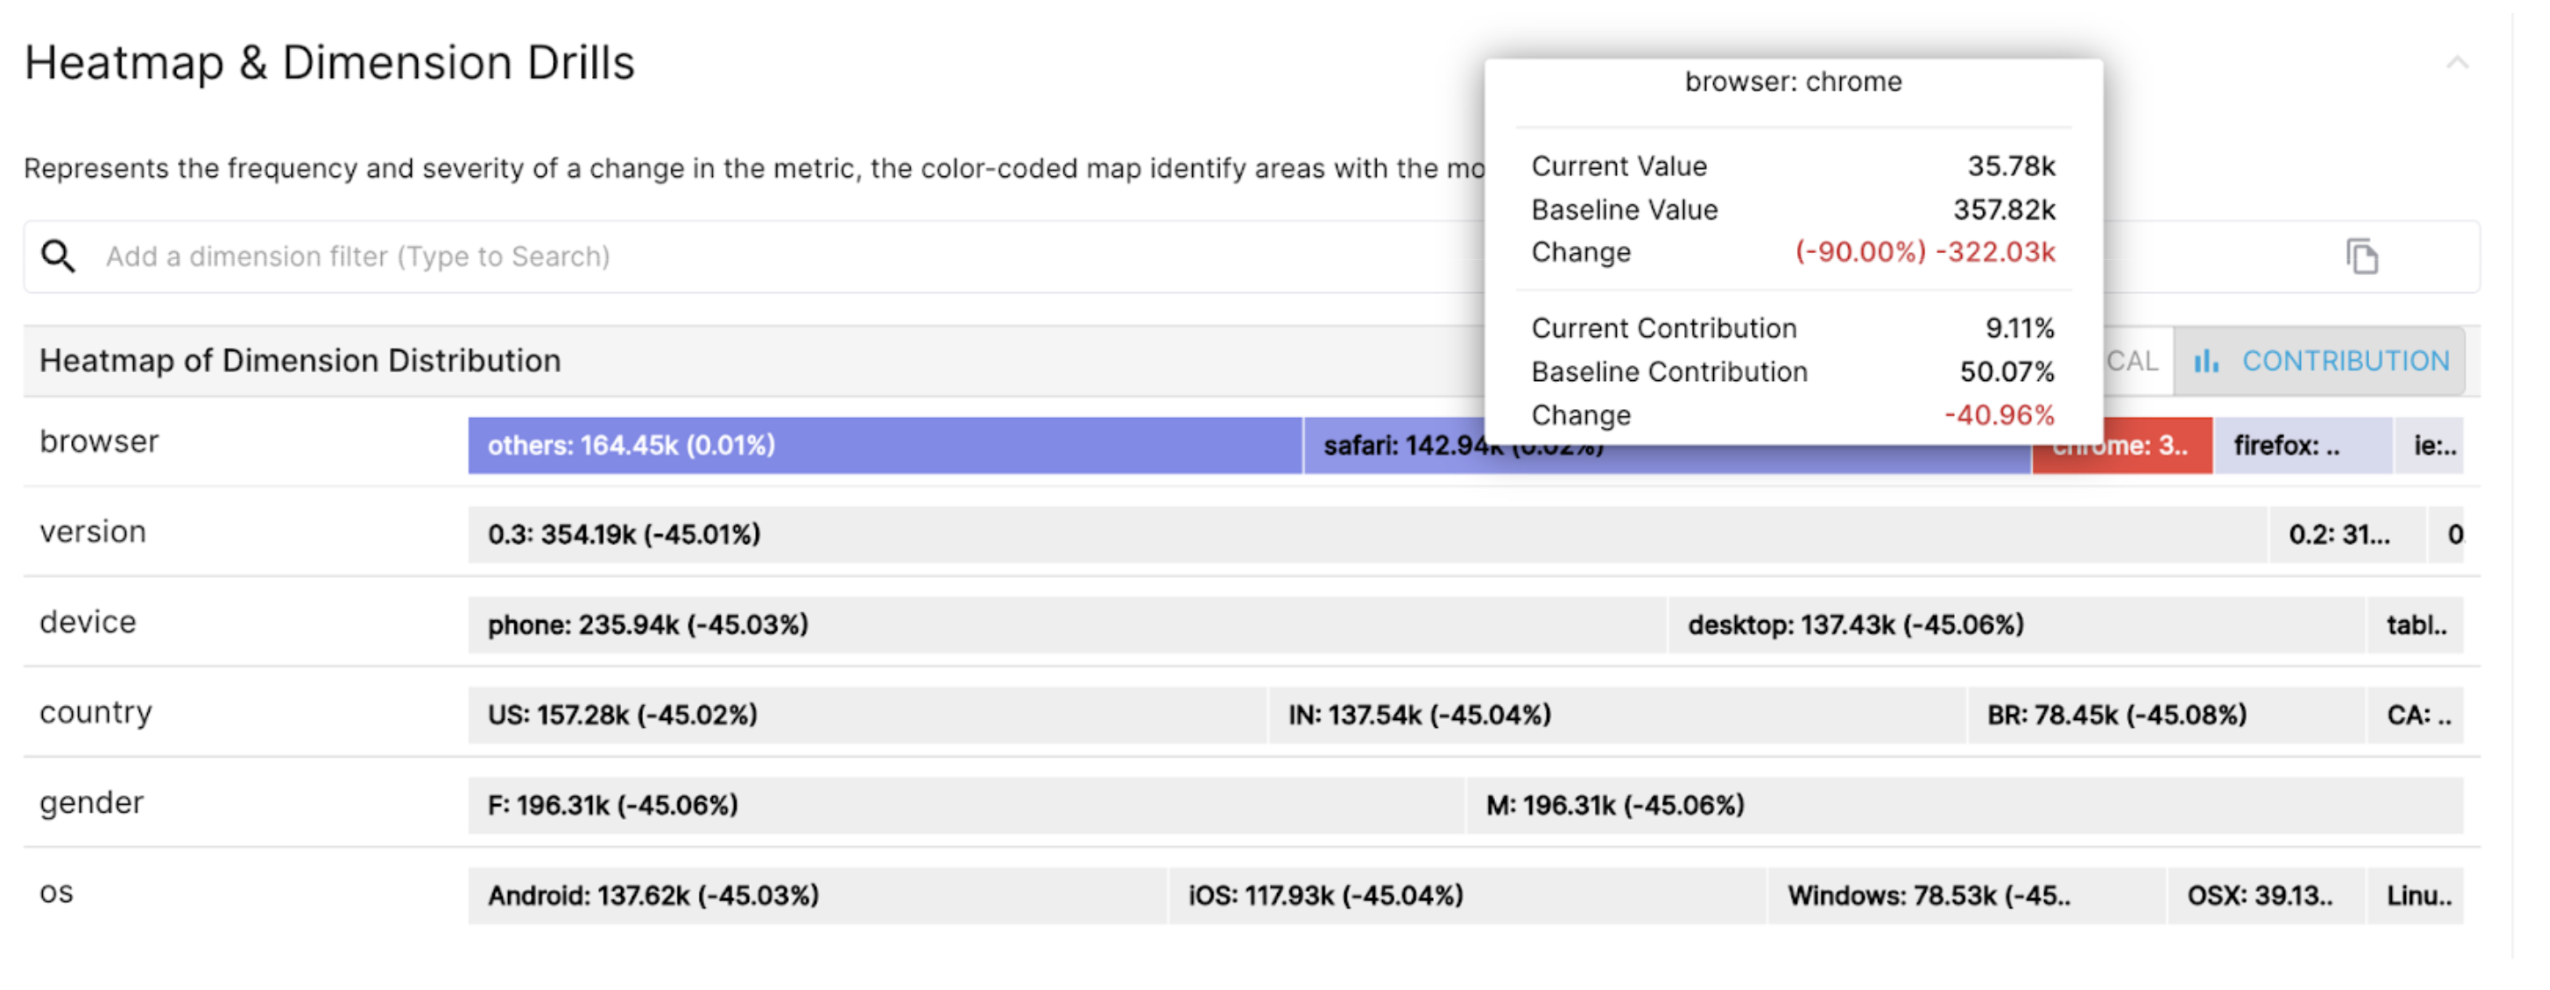
RCA Visualizations
Saving the Investigation
Next, after taking a closer look at the two RCA visualizations, let’s save our investigation. Optionally, you can add dimensions to your Investigation Preview at the bottom. The Investigation Preview at the bottom will update with graphs of the dimensions you choose.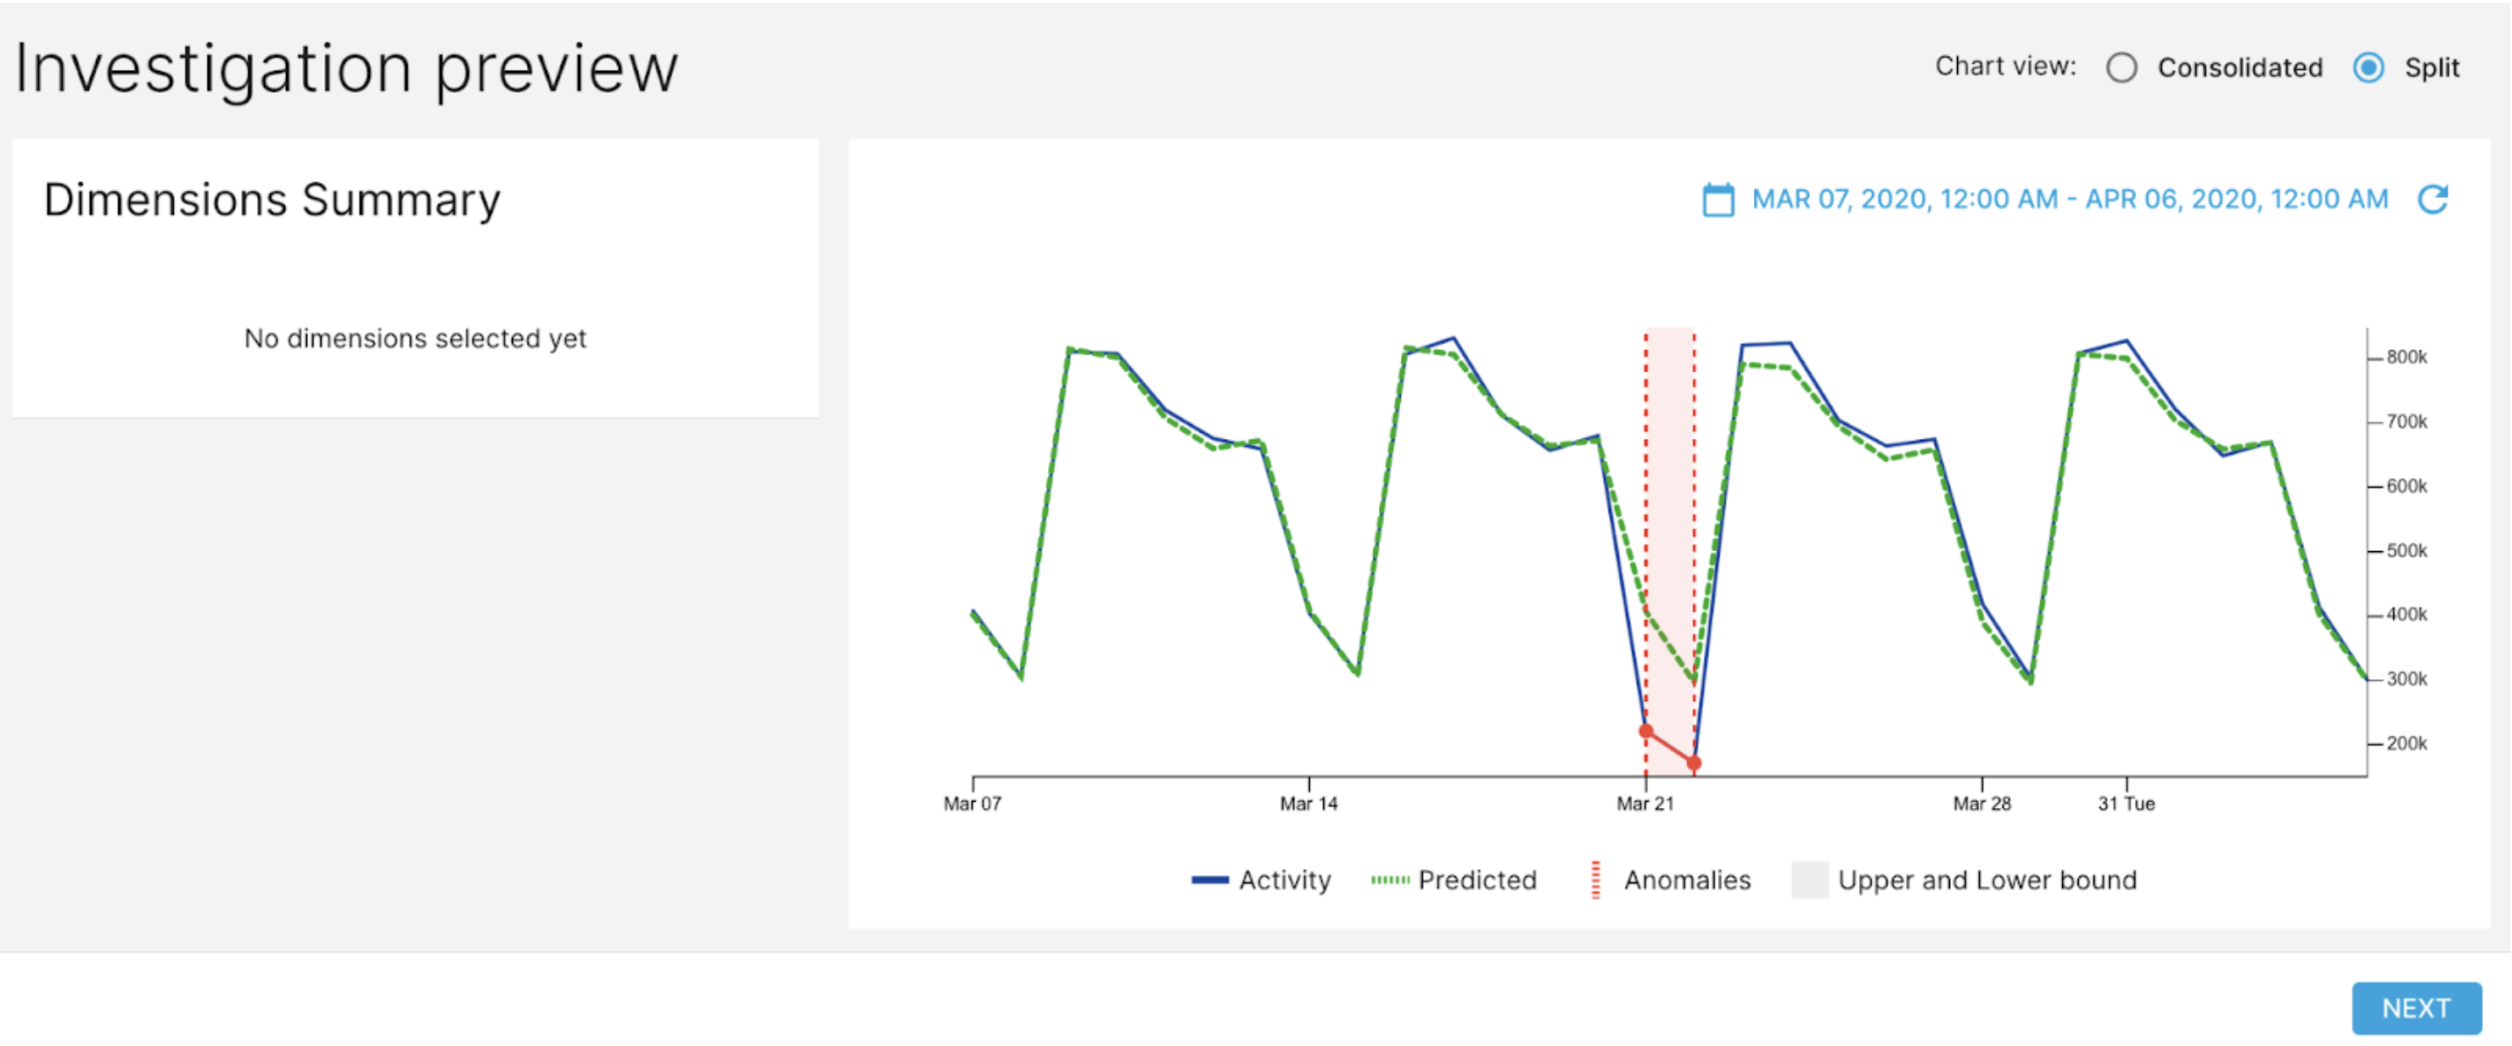
Confirming your anomaly
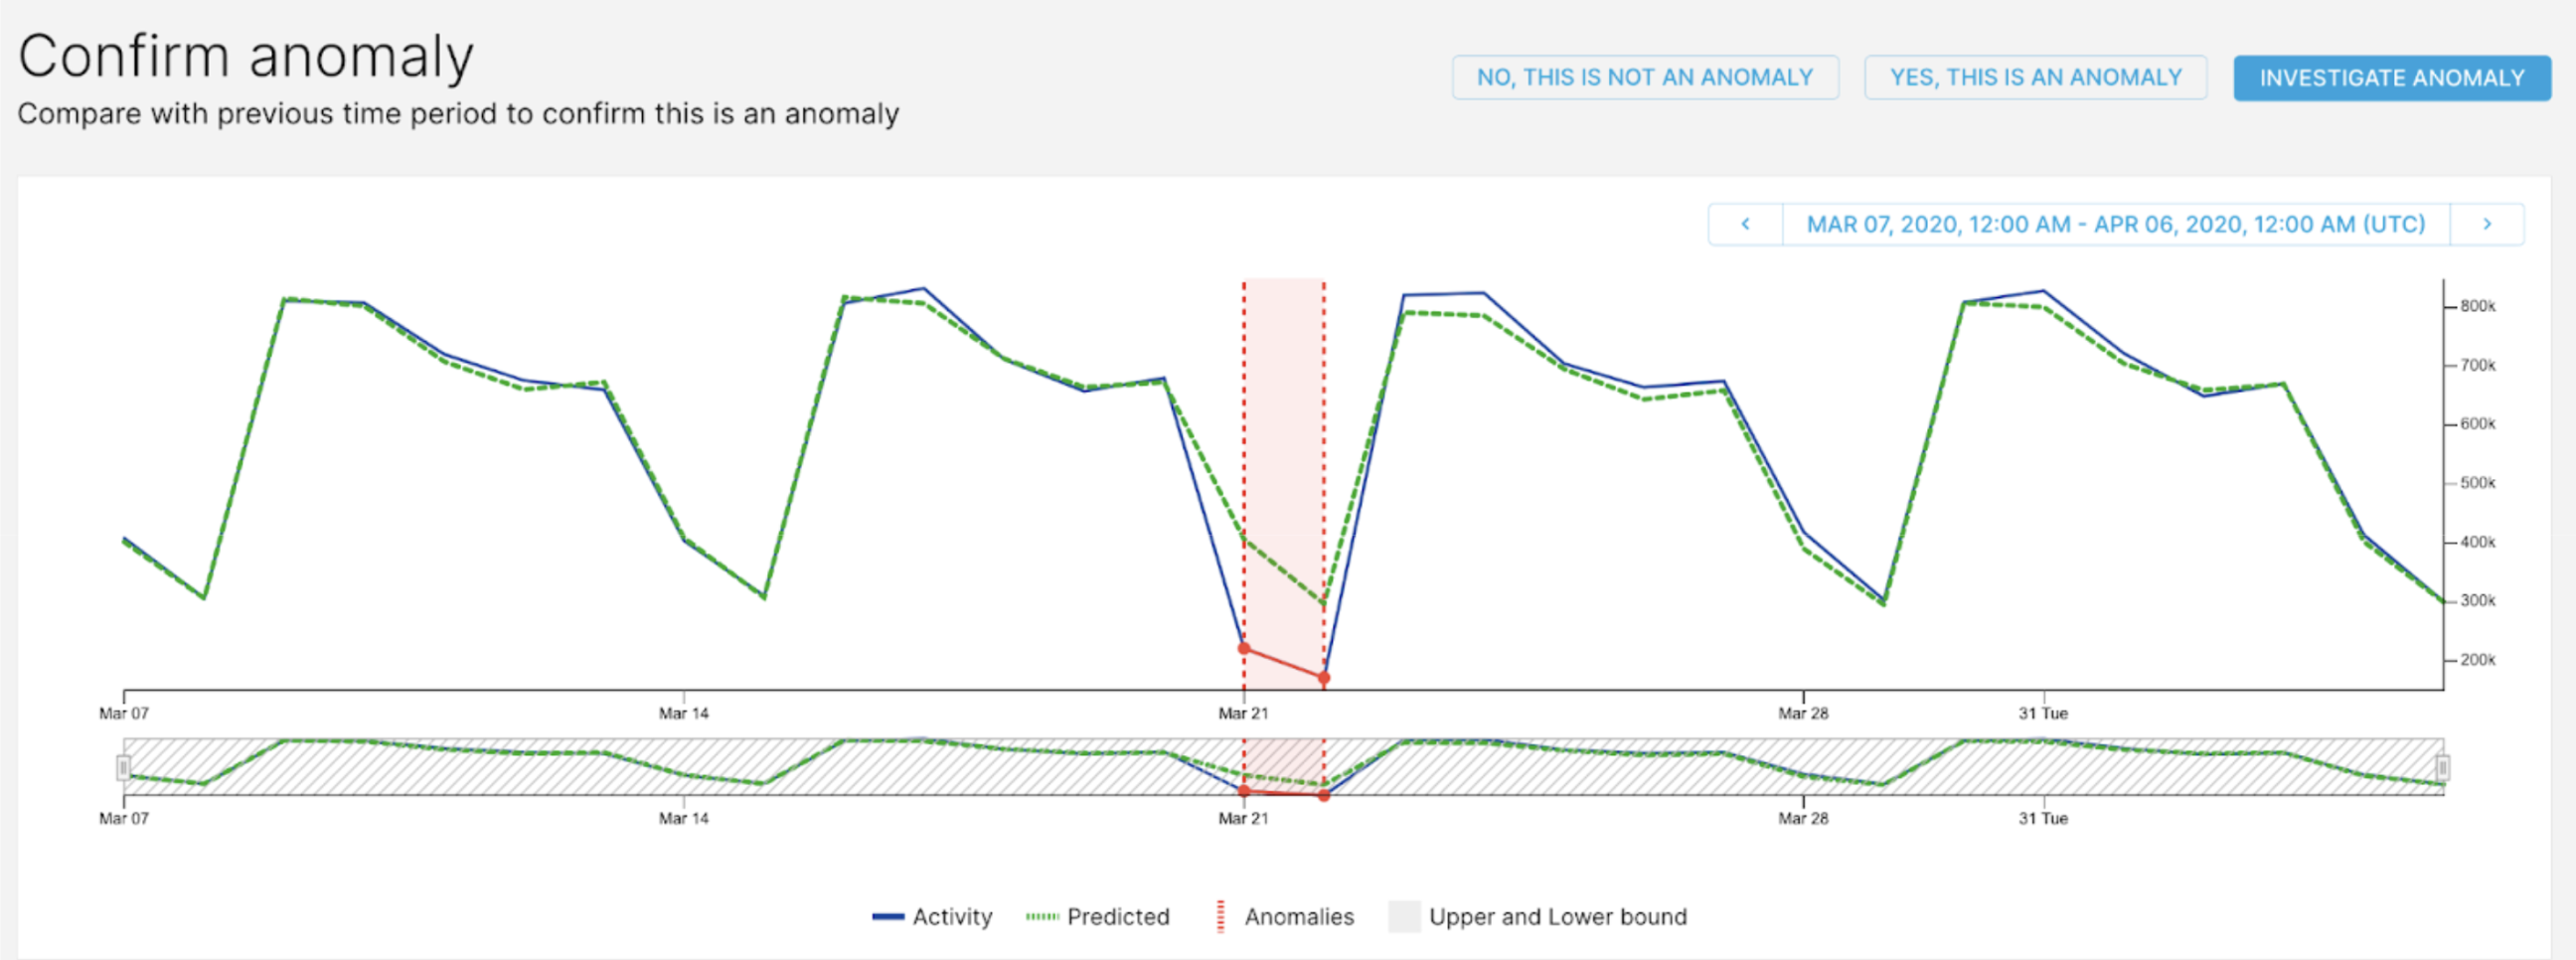
After saving the investigation, confirm to ThirdEye that an anomaly has been found. ThirdEye takes the feedback for true positive anomalies and false positive anomalies and tunes the model accordingly to give you more accurate results.