Challenges faced by rideshare apps
In order to be competitive, rideshare apps must provide fast and timely rides for their customers. When wait times and ride cancellations begin to spike, quick action is critical to restoring customer satisfaction. Wait times can be affected by external factors such as weather, traffic, driver availability, and more. When wait times are too long, customers begin to look for alternatives. This often leads to customers cancelling their current ride in order to try for a closer driver or choosing an alternative option. Cancelled rides add extra stress and costs to a system already struggling to provide timely rides. Quickly and confidently responding to changes in wait time and other key metrics will have a big impact on customer satisfaction and retention.How anomaly detection helps
In order to respond to deviations in key metrics, we need a system that detects these deviations and notifies us that they have occurred. When the deviation is large enough, the side effects are readily apparent; site outages, angry customers, and damage to the brand. ThirdEye uses statistical models and dimensional analysis to detect smaller deviations and anomalies before they become big problems. Aggregate timeseries can often mask anomalies that occur in a single dimension of the data. For example, a single city might see wait times increase 10x, but this increase may have a negligible effect on the aggregate wait time across all cities. ThirdEye can run anomaly detection across multiple dimensions of data to detect these local anomalies. ThirdEye automatically detects when our key metrics unexpectedly deviate from their normal behavior, even across multiple dimensions. ThirdEye can report these anomalies to Slack, email, or an external webhook. Anomaly detect for ride cancellations: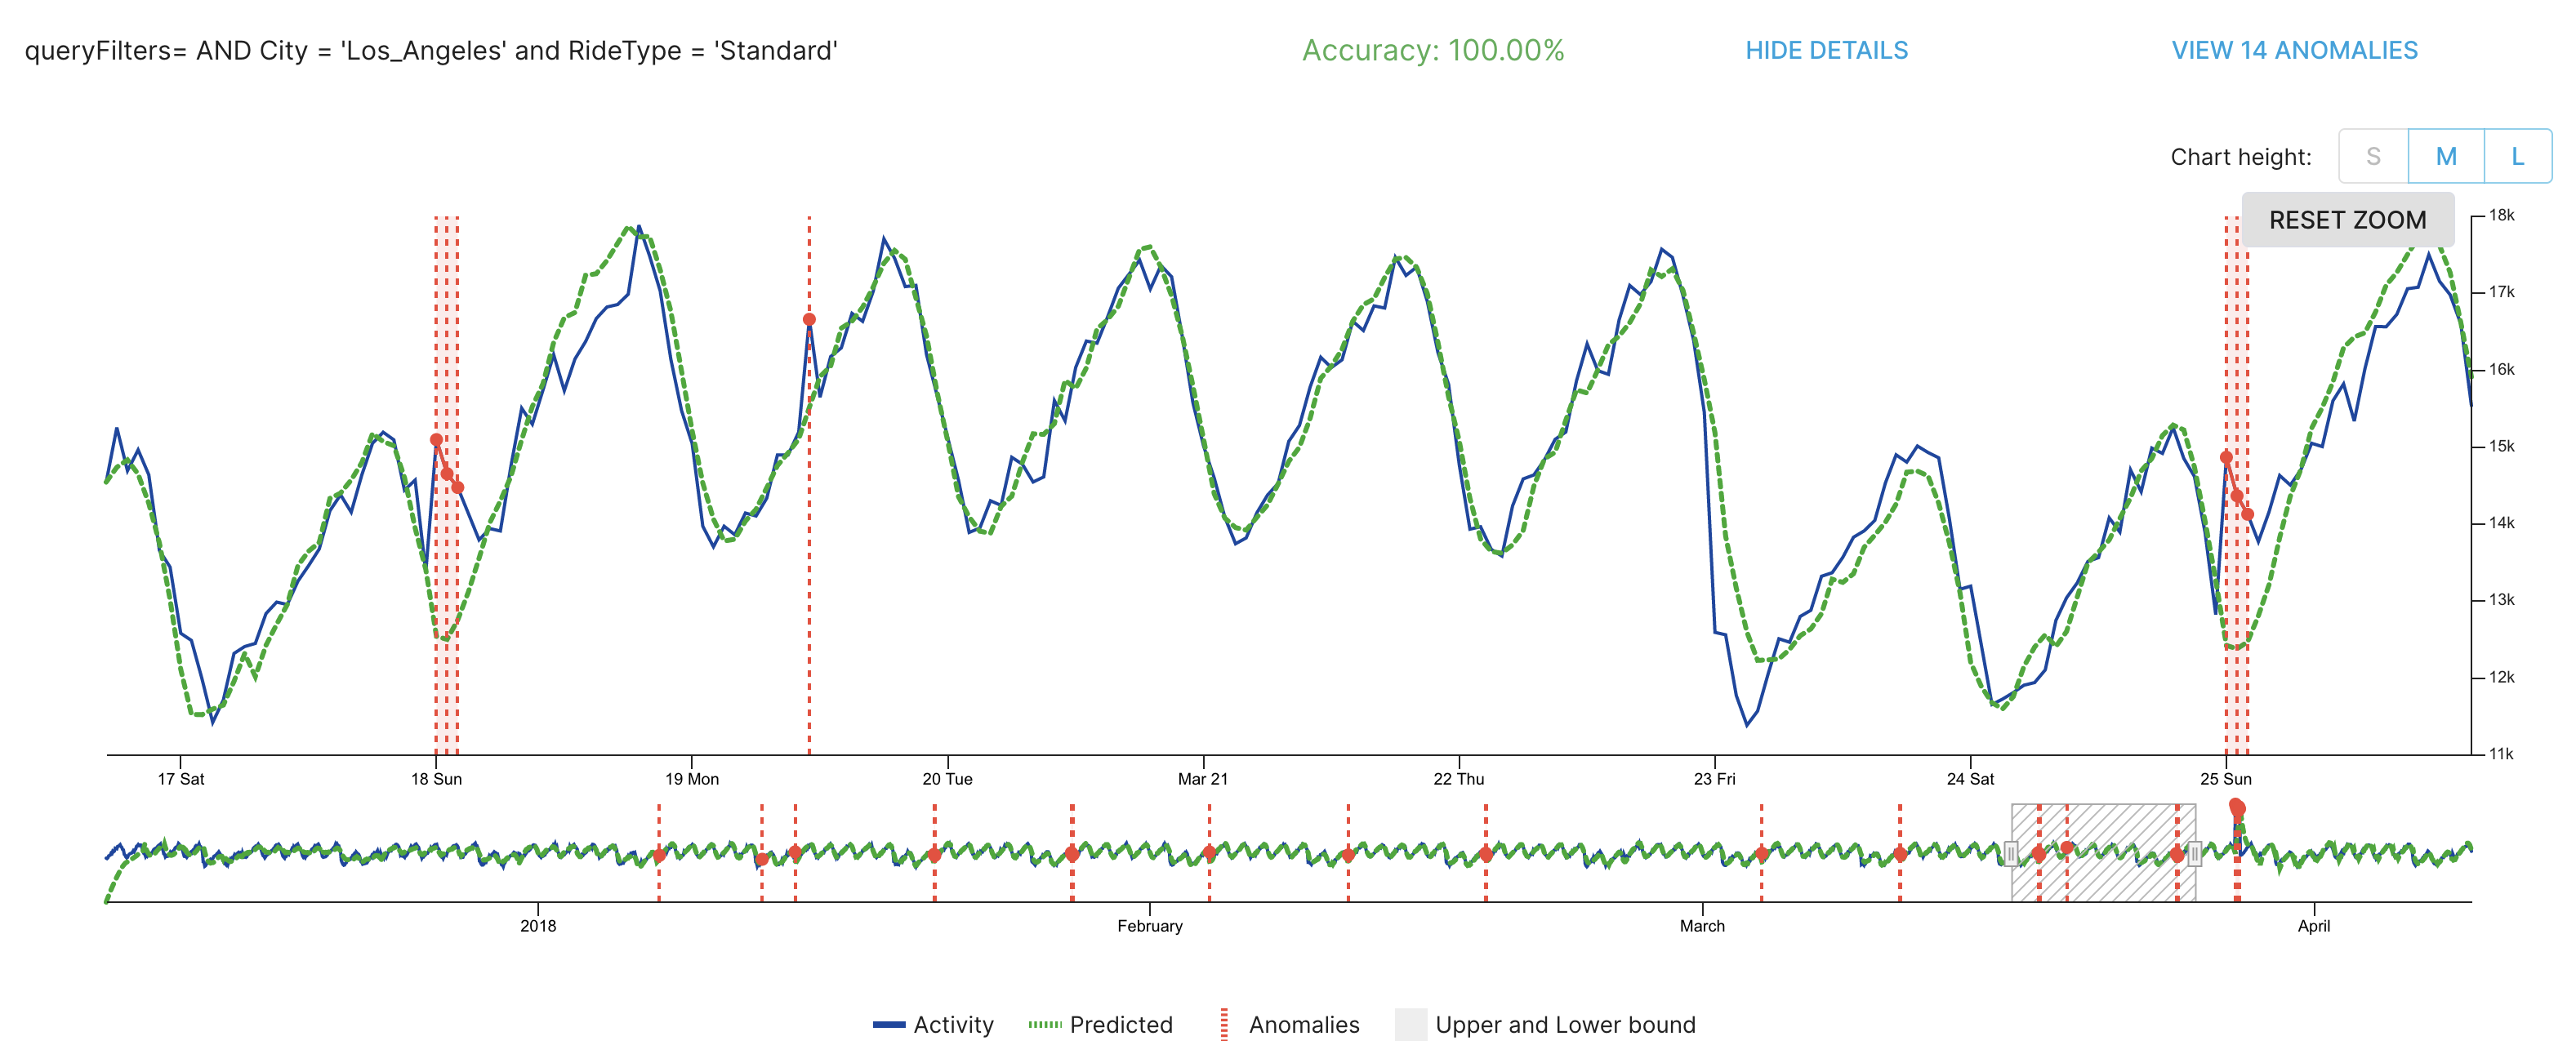
Interested in trying out StarTree ThirdEye?
Follow this link to find different deployment options for trying out StarTree ThirdEye.Architecture diagram

Steps to try StarTree ThirdEye anomaly detection for real-time or near real-time monitoring
- Data preparation and availability
- Data ingestion
- Alert creation and notifications
- Tuning anomaly detection models (if needed based on use-case and context)
- Anomaly reporting
- Root cause analysis/anomaly investigation
Data preparation and availability
- Identify key metrics to monitor.
This recipe uses:- Ride_Cancellations
- Ride_Request_WaitTime
- Driver_Request_API_Errors
- Identify the dimensions that are applicable for a given metric.
This recipe uses:- City
- Device_Type
- RideType
- Decide granularity for your detection:
- Granularity enables you for real-time or near real-time monitoring (hourly/daily/weekly time series). The sample data is aggregated into hourly buckets, so this recipe uses hourly granularity.

Data ingestion
- Download this CSV file link.
- Ingest this CSV data to Pinot using the Pinot API.
| timestamp | RideType | City | Device_Type | OS_Version | Ride_Cancellations | Rides_Completed | Ride_Request_WaitTime | Driver_Request_API_Errors |
|---|---|---|---|---|---|---|---|---|
| 1512867600 | Shared | Los_Angeles | Mobile | Android | 6241.5174 | 11320.5833 | 2434.6632 | 1772.2415 |
| 1512871200 | Shared | Los_Angeles | Mobile | Android | 6840.4272 | 11429.2984 | 2611.5766 | 1886.1431 |
| 1512874800 | Shared | Los_Angeles | Mobile | Android | 7421.9474 | 11509.1625 | 2859.7099 | 1970.7529 |
| 1512878400 | Shared | Los_Angeles | Mobile | Android | 7780.715 | 11350.5748 | 2986.9979 | 2076.0819 |
| 1512882000 | Shared | Los_Angeles | Mobile | Android | 7996.7762 | 11804.1036 | 2976.7476 | 2238.1518 |
Alert creation and notifications
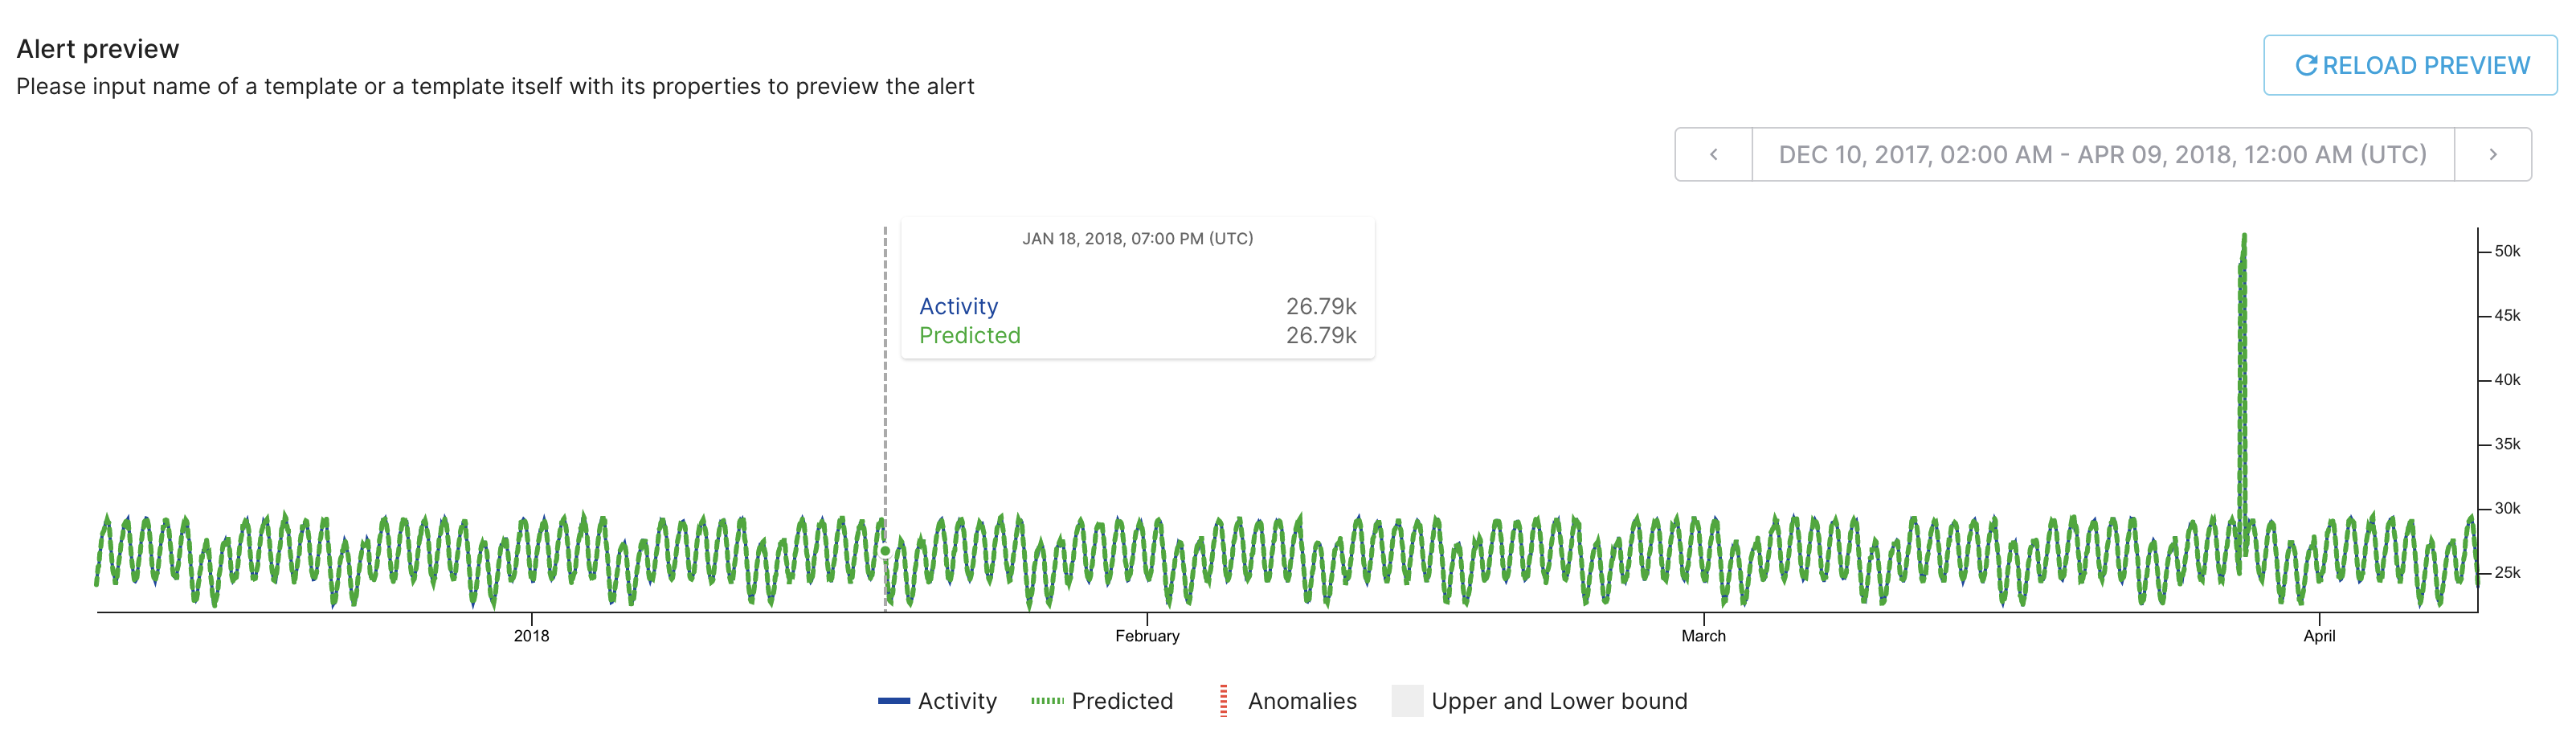
To create our alerts, we need to inspect the timeseries for trends, seasonality, and obvious outliers. ThirdEye’s alert preview lets us view the timeseries and the predicted anomalies. To start, we’ll preview the data using the simplest alert temlate,startree-threshold.
Copy and paste the following into ThirdEye’s alert json editor:
Alert Configuration for Wait Time
Alert Configuration for Cancellations
Alert Configuration for Api Errors
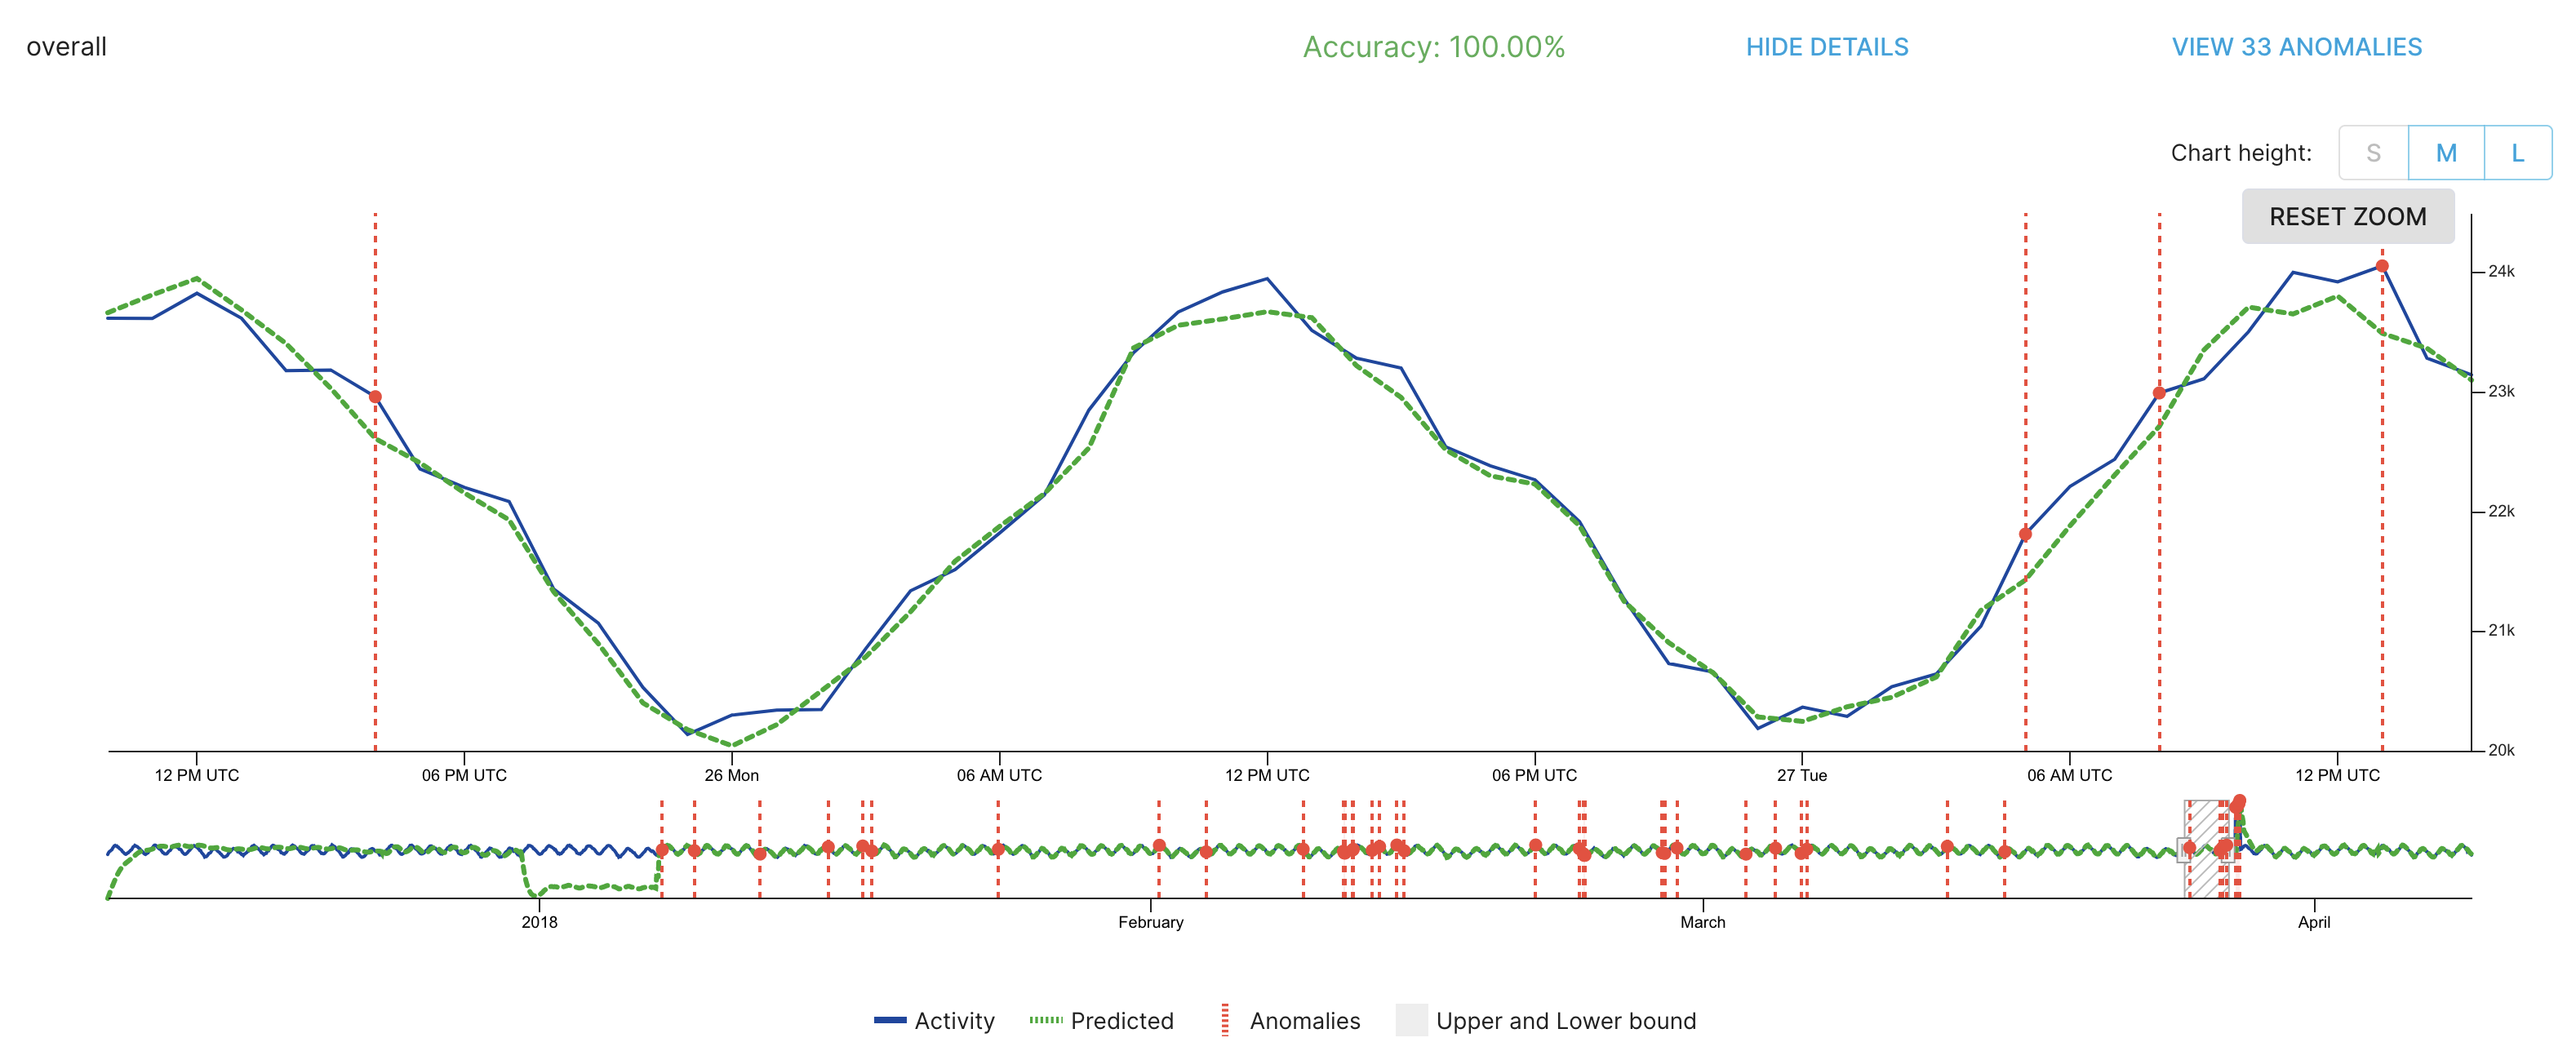
Anomaly reporting
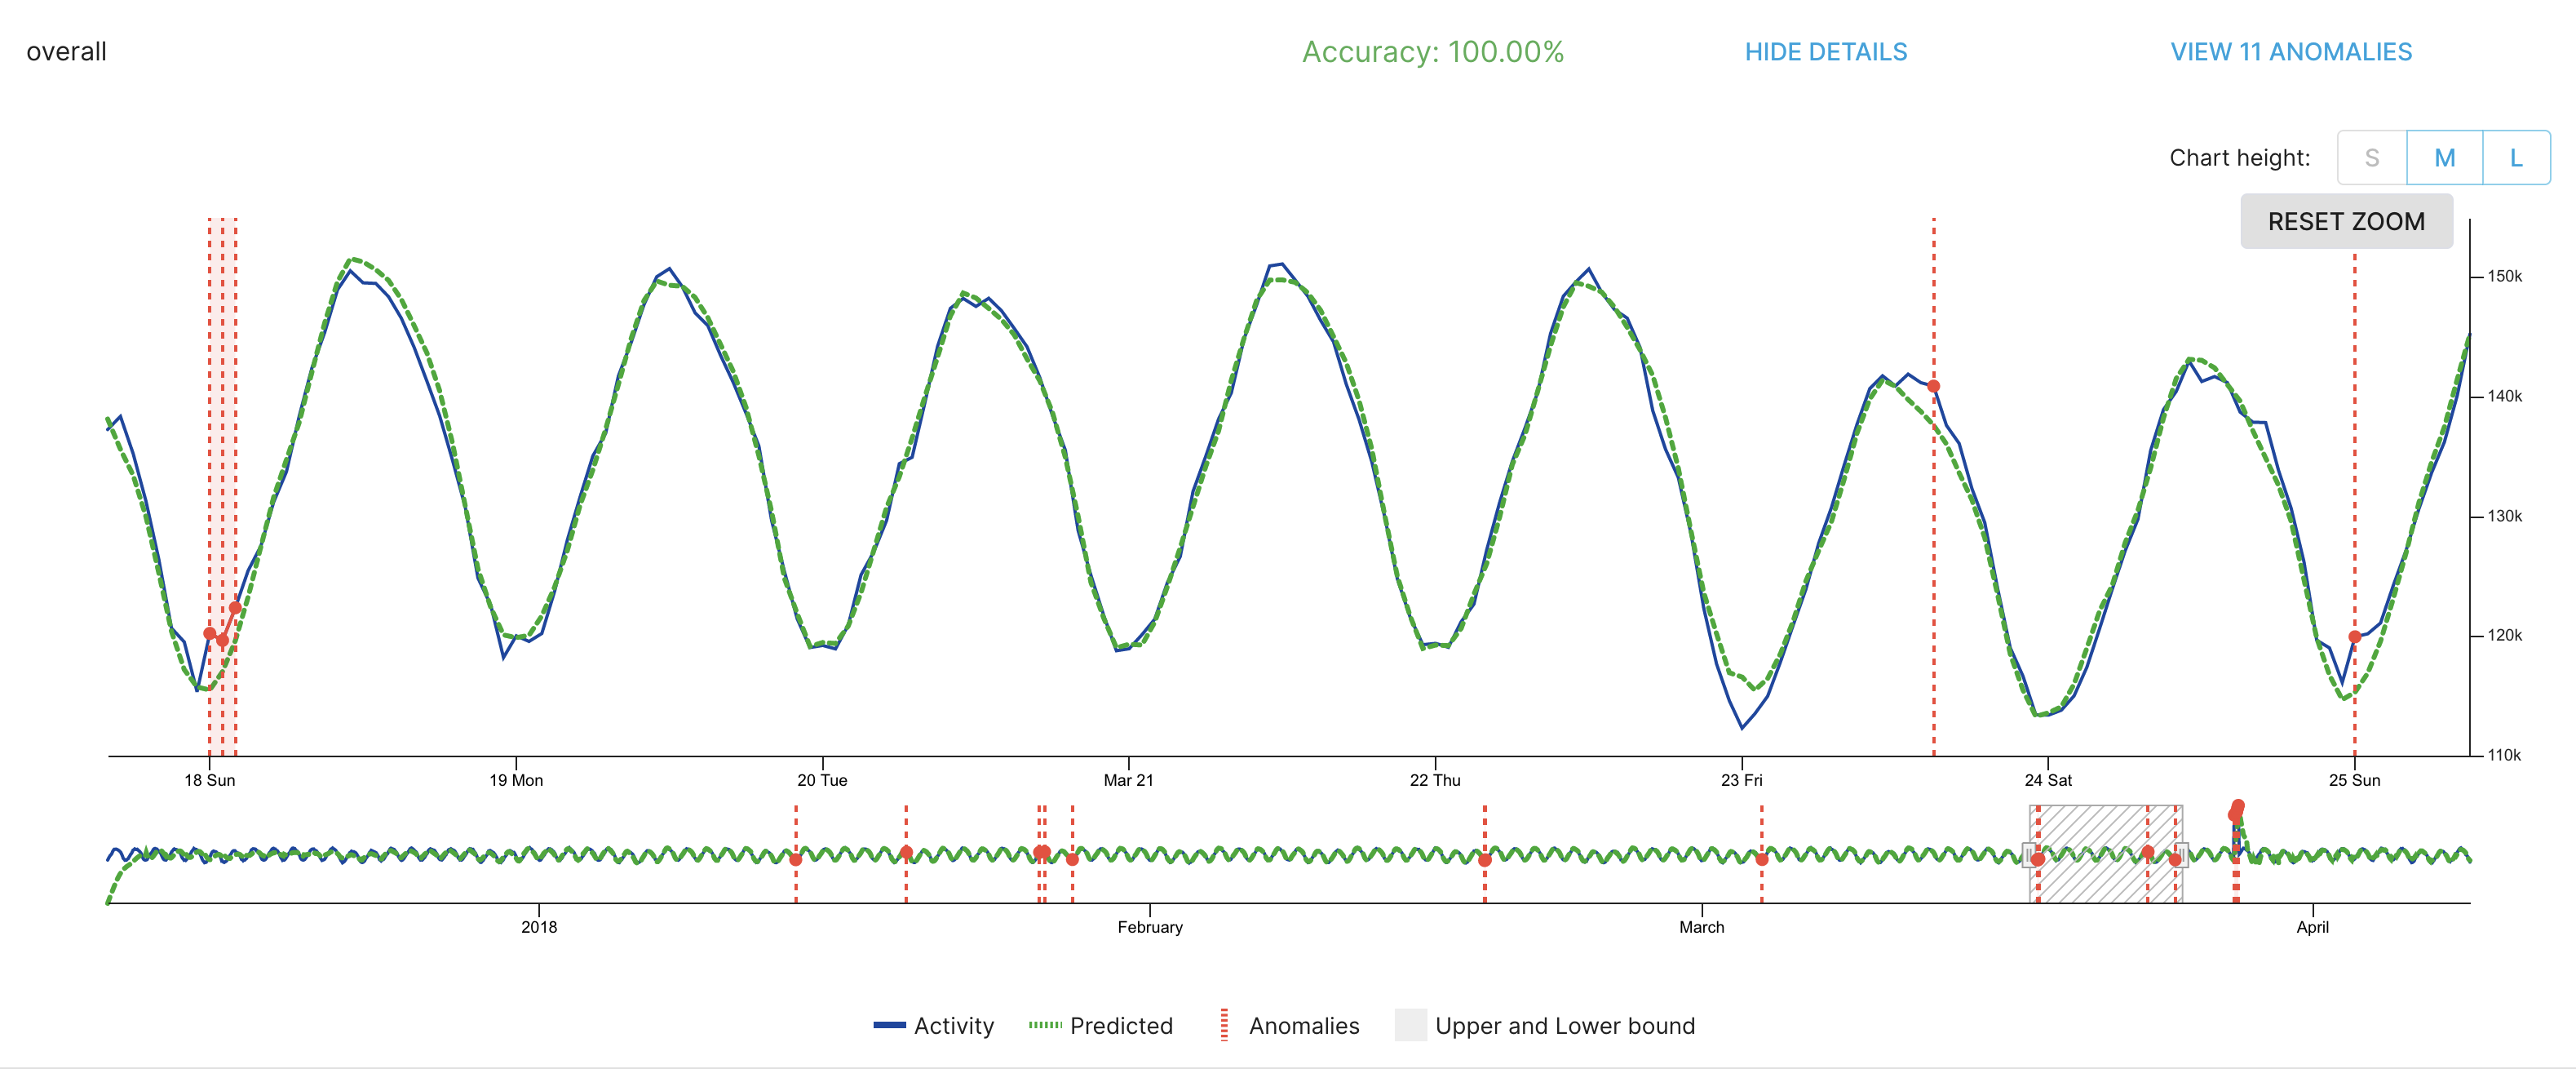
Now that the alerts are created, we view the detected anomalies for each alert and it’s dimensions. To see anomalies for a single alert, click Alerts in the sidebar, then click on the alert you want to inspect. To see anomalies for all alerts, click on Anomalies in the sidebar. Below are screenshots from the anomaly detection results. The graphs are zoomed in to show the most interesting results. Anomalies in wait time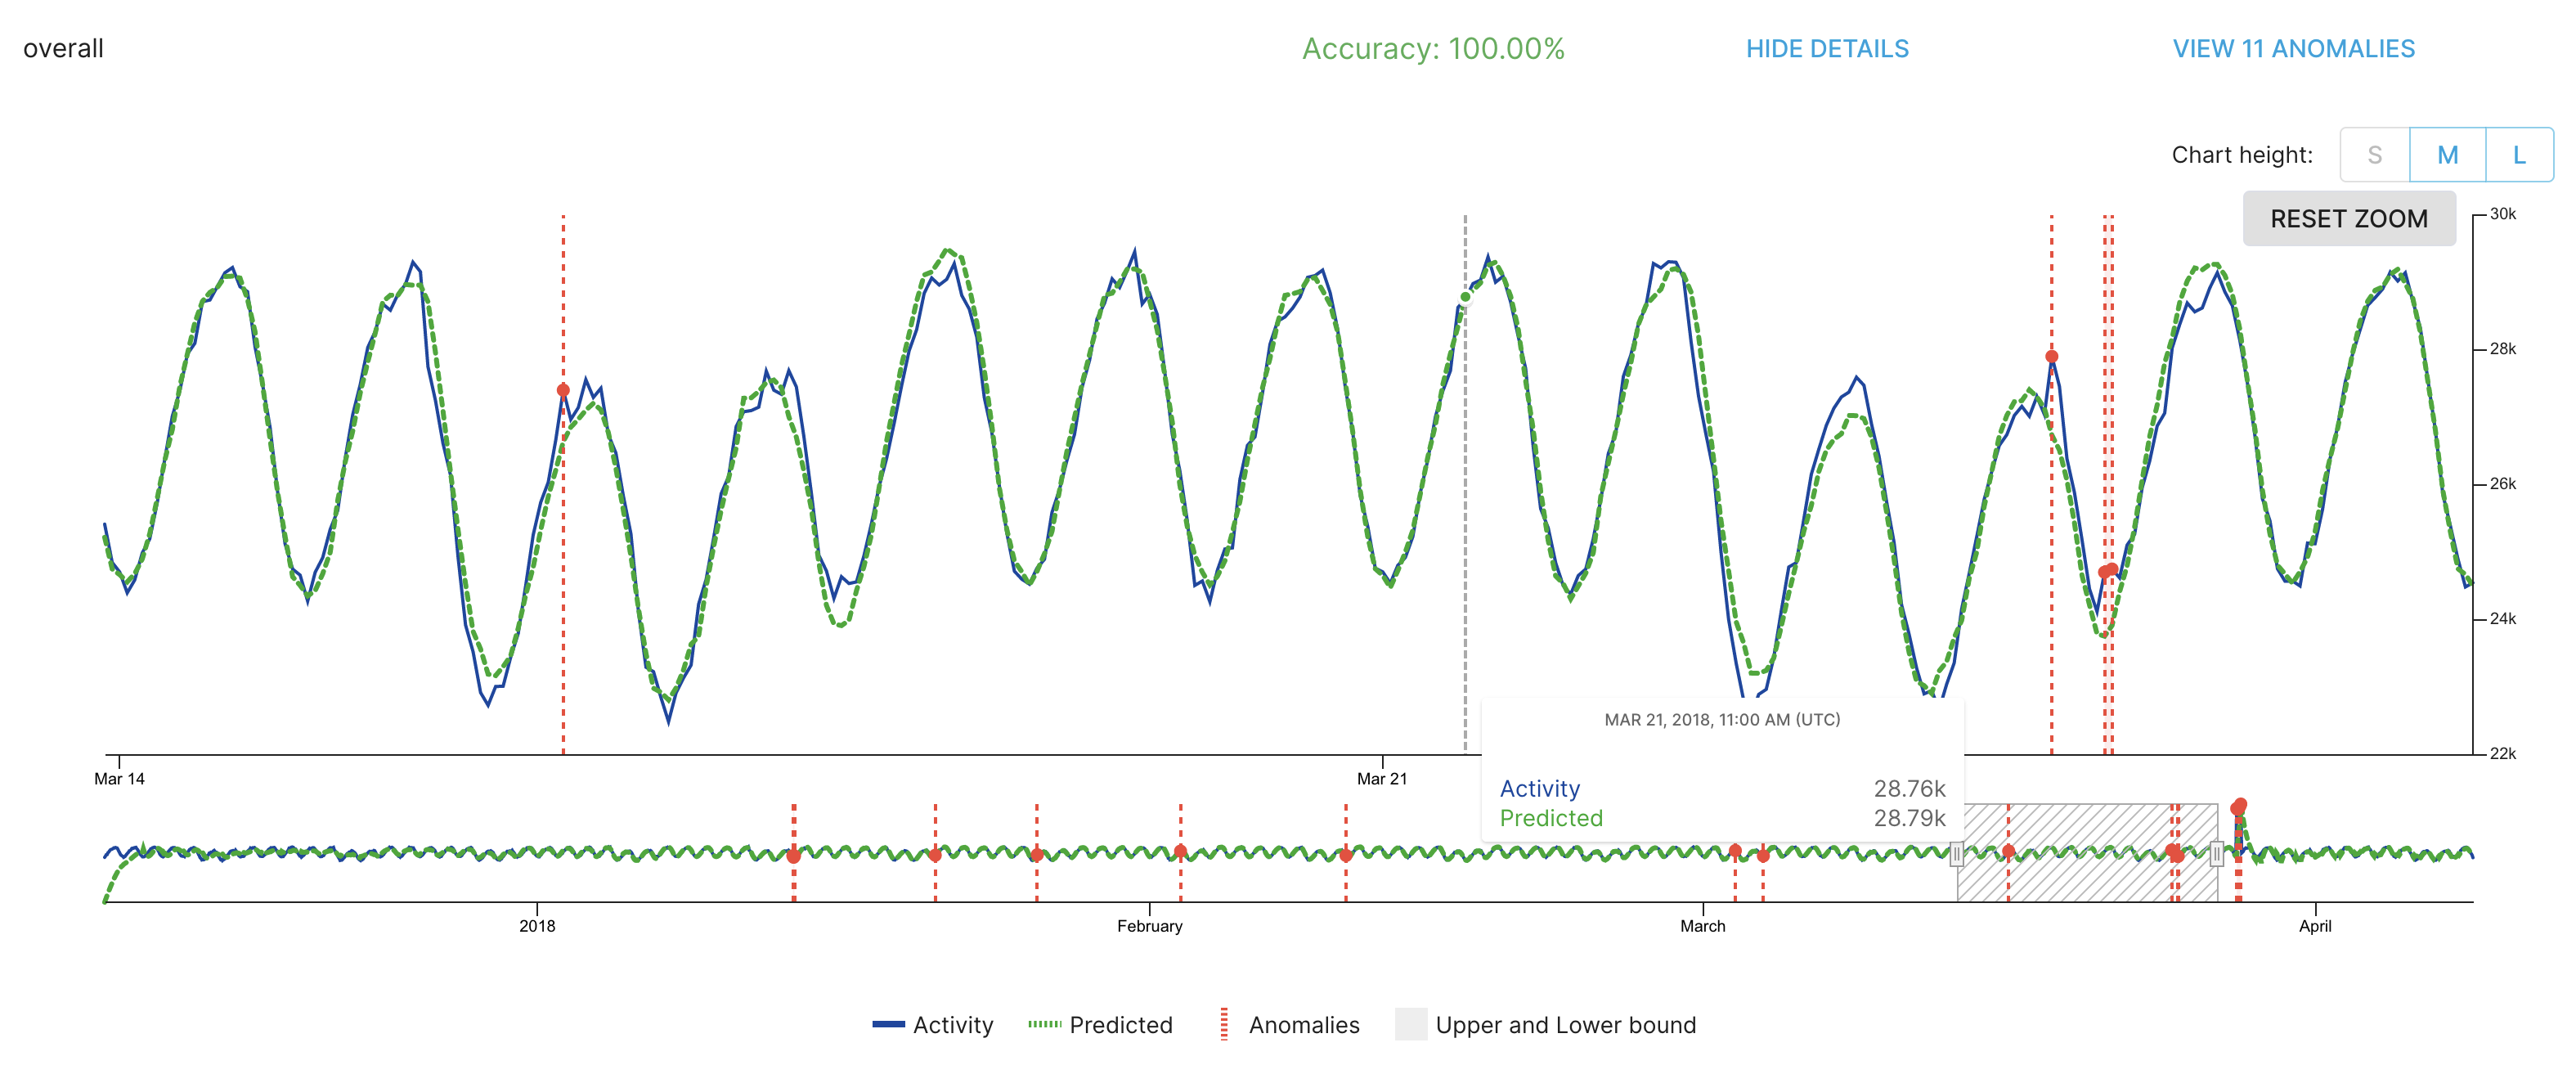
- View Anomalies directly in ThirdEye.
- Email, Slack, and webhook notifications.
- Programmatically with ThirdEye’s API.