- Use familiar Prometheus-style queries while leveraging Pinot’s scalable analytics capabilities.
- Query high-cardinality time series data efficiently.
- Take advantage of StarTree Cloud optimized storage and indexing.
The Time Series Engine and PromQL support in StarTree Cloud are currently in an alpha release.
Prerequisites
Before querying metrics with PromQL, ensure you have:- A running Pinot cluster.
- Metrics data ingested into tables using the Prometheus message decoder.
Configuration
No additional configuration is required to enable TSE or PromQL. The Time Series Engine and PromQL support are enabled by default in StarTree Cloud. The PromQL endpoint is available at<Broker-endpoint>:8000/timeseries. Supported PromQL queries can be executed on this endpoint - see Supported PromQL Expressions for details.
Data Ingestion Using Real-time Tables
To ingest Prometheus metrics data in real-time, you’ll need to configure both the schema and table configuration properly. The Prometheus Message Decoder expects data in the following format:Required Schema Configuration
Your schema must include these specific fields with the exact names and data types:| Field | Type | Description |
|---|---|---|
metric | STRING | Name of the Prometheus metric |
labels | JSON | Key-value pairs of Prometheus labels |
value | DOUBLE | The numeric value of the metric |
ts | TIMESTAMP | Timestamp in milliseconds since the Unix epoch |
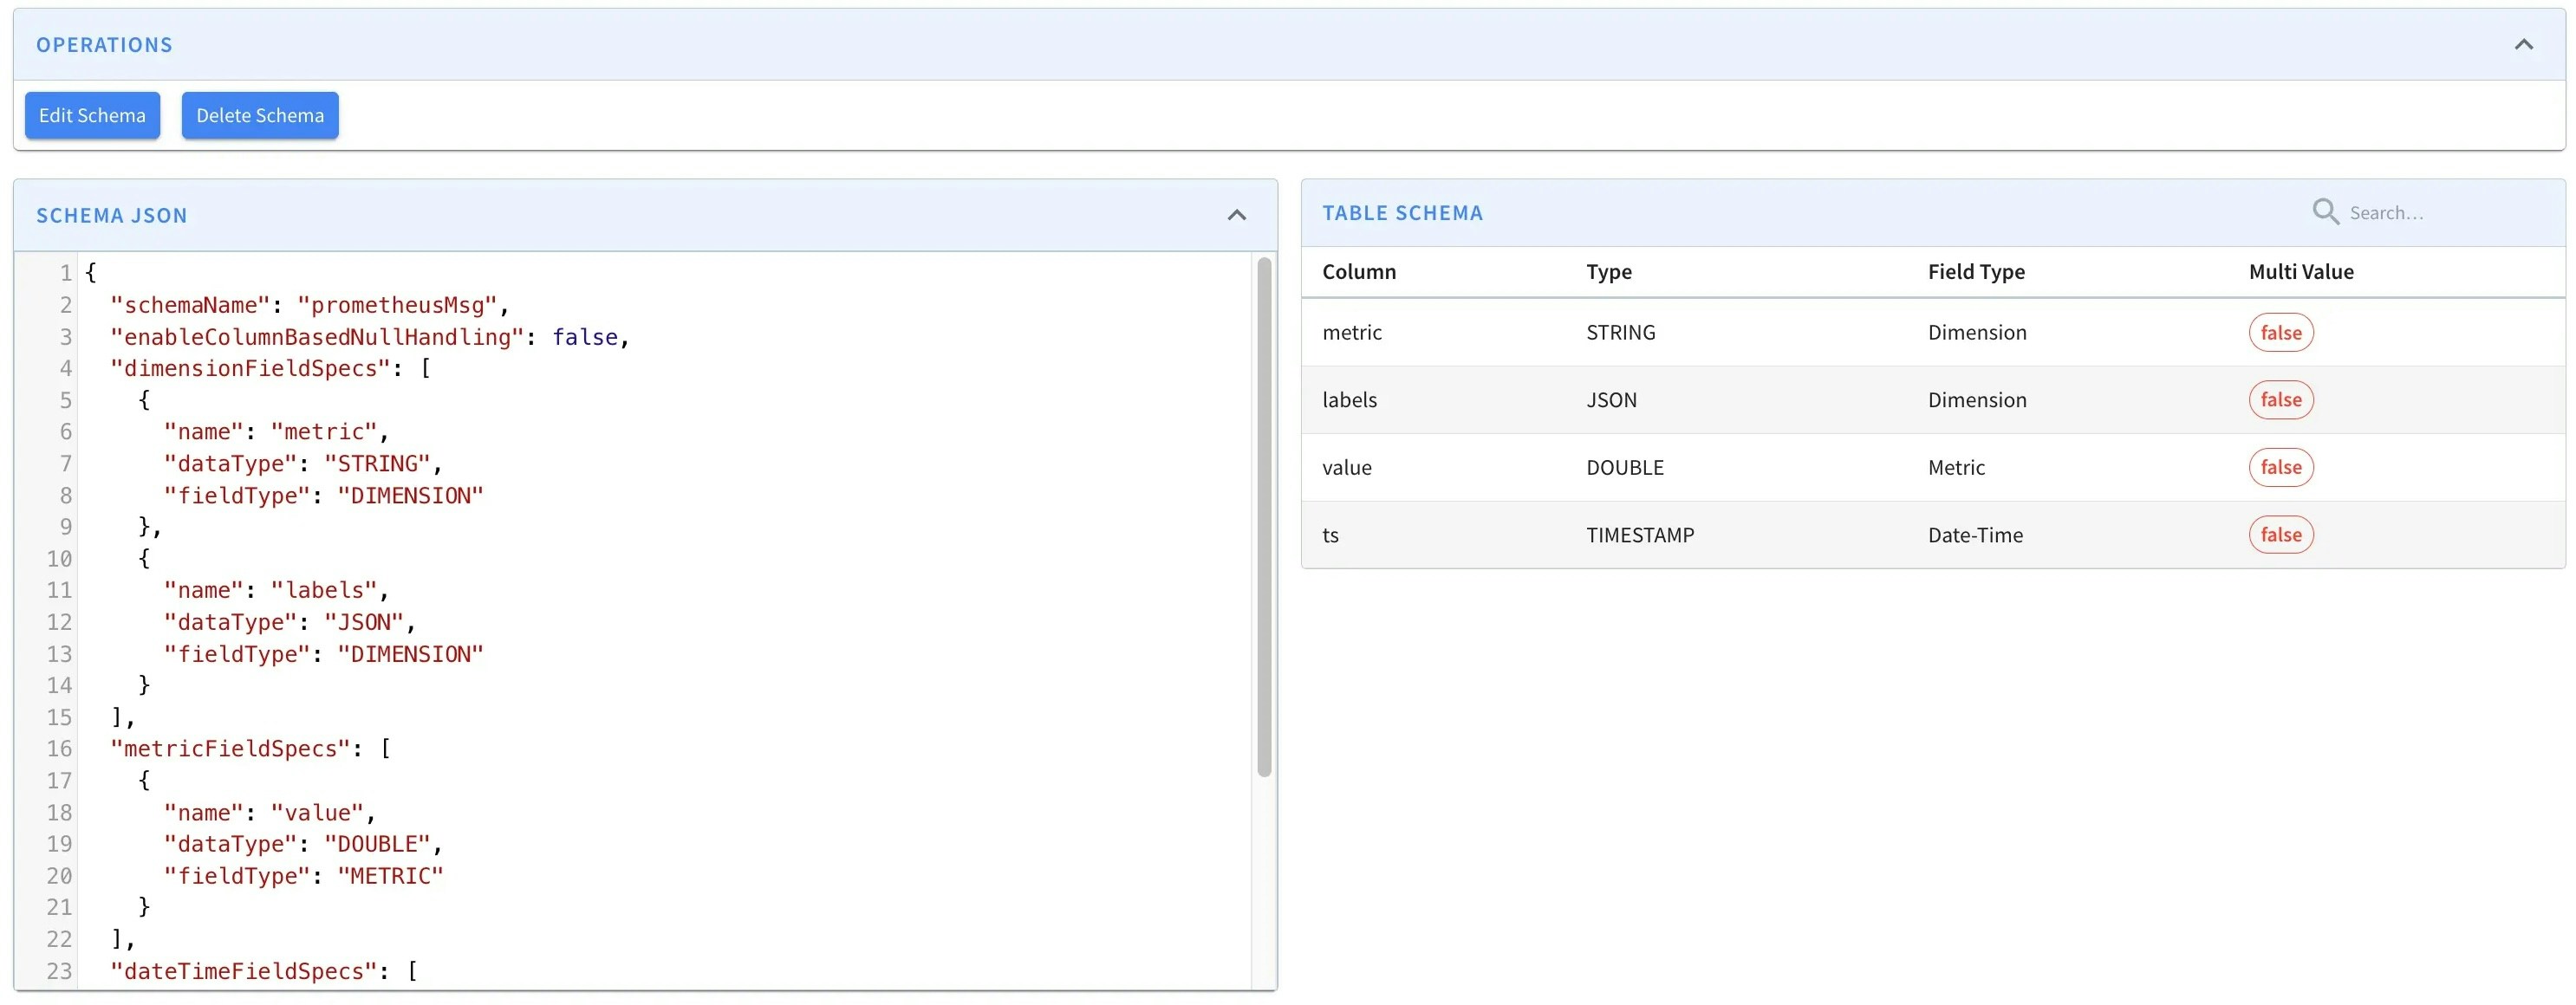
Table Configuration
For real-time ingestion, configure your table with the Prometheus Message Decoder:-
Set the table type to
REALTIME -
Configure the stream settings to use
PrometheusMessageDecoder -
Set appropriate flush thresholds for your use case

Sample Data Format
Important Considerations
- The schema field names (
metric,labels,value,ts) must match exactly as specified. - If you need different field names, use transform functions to alias them.
- The timestamp must be in milliseconds since Unix epoch.
- The labels field must be properly formatted JSON.
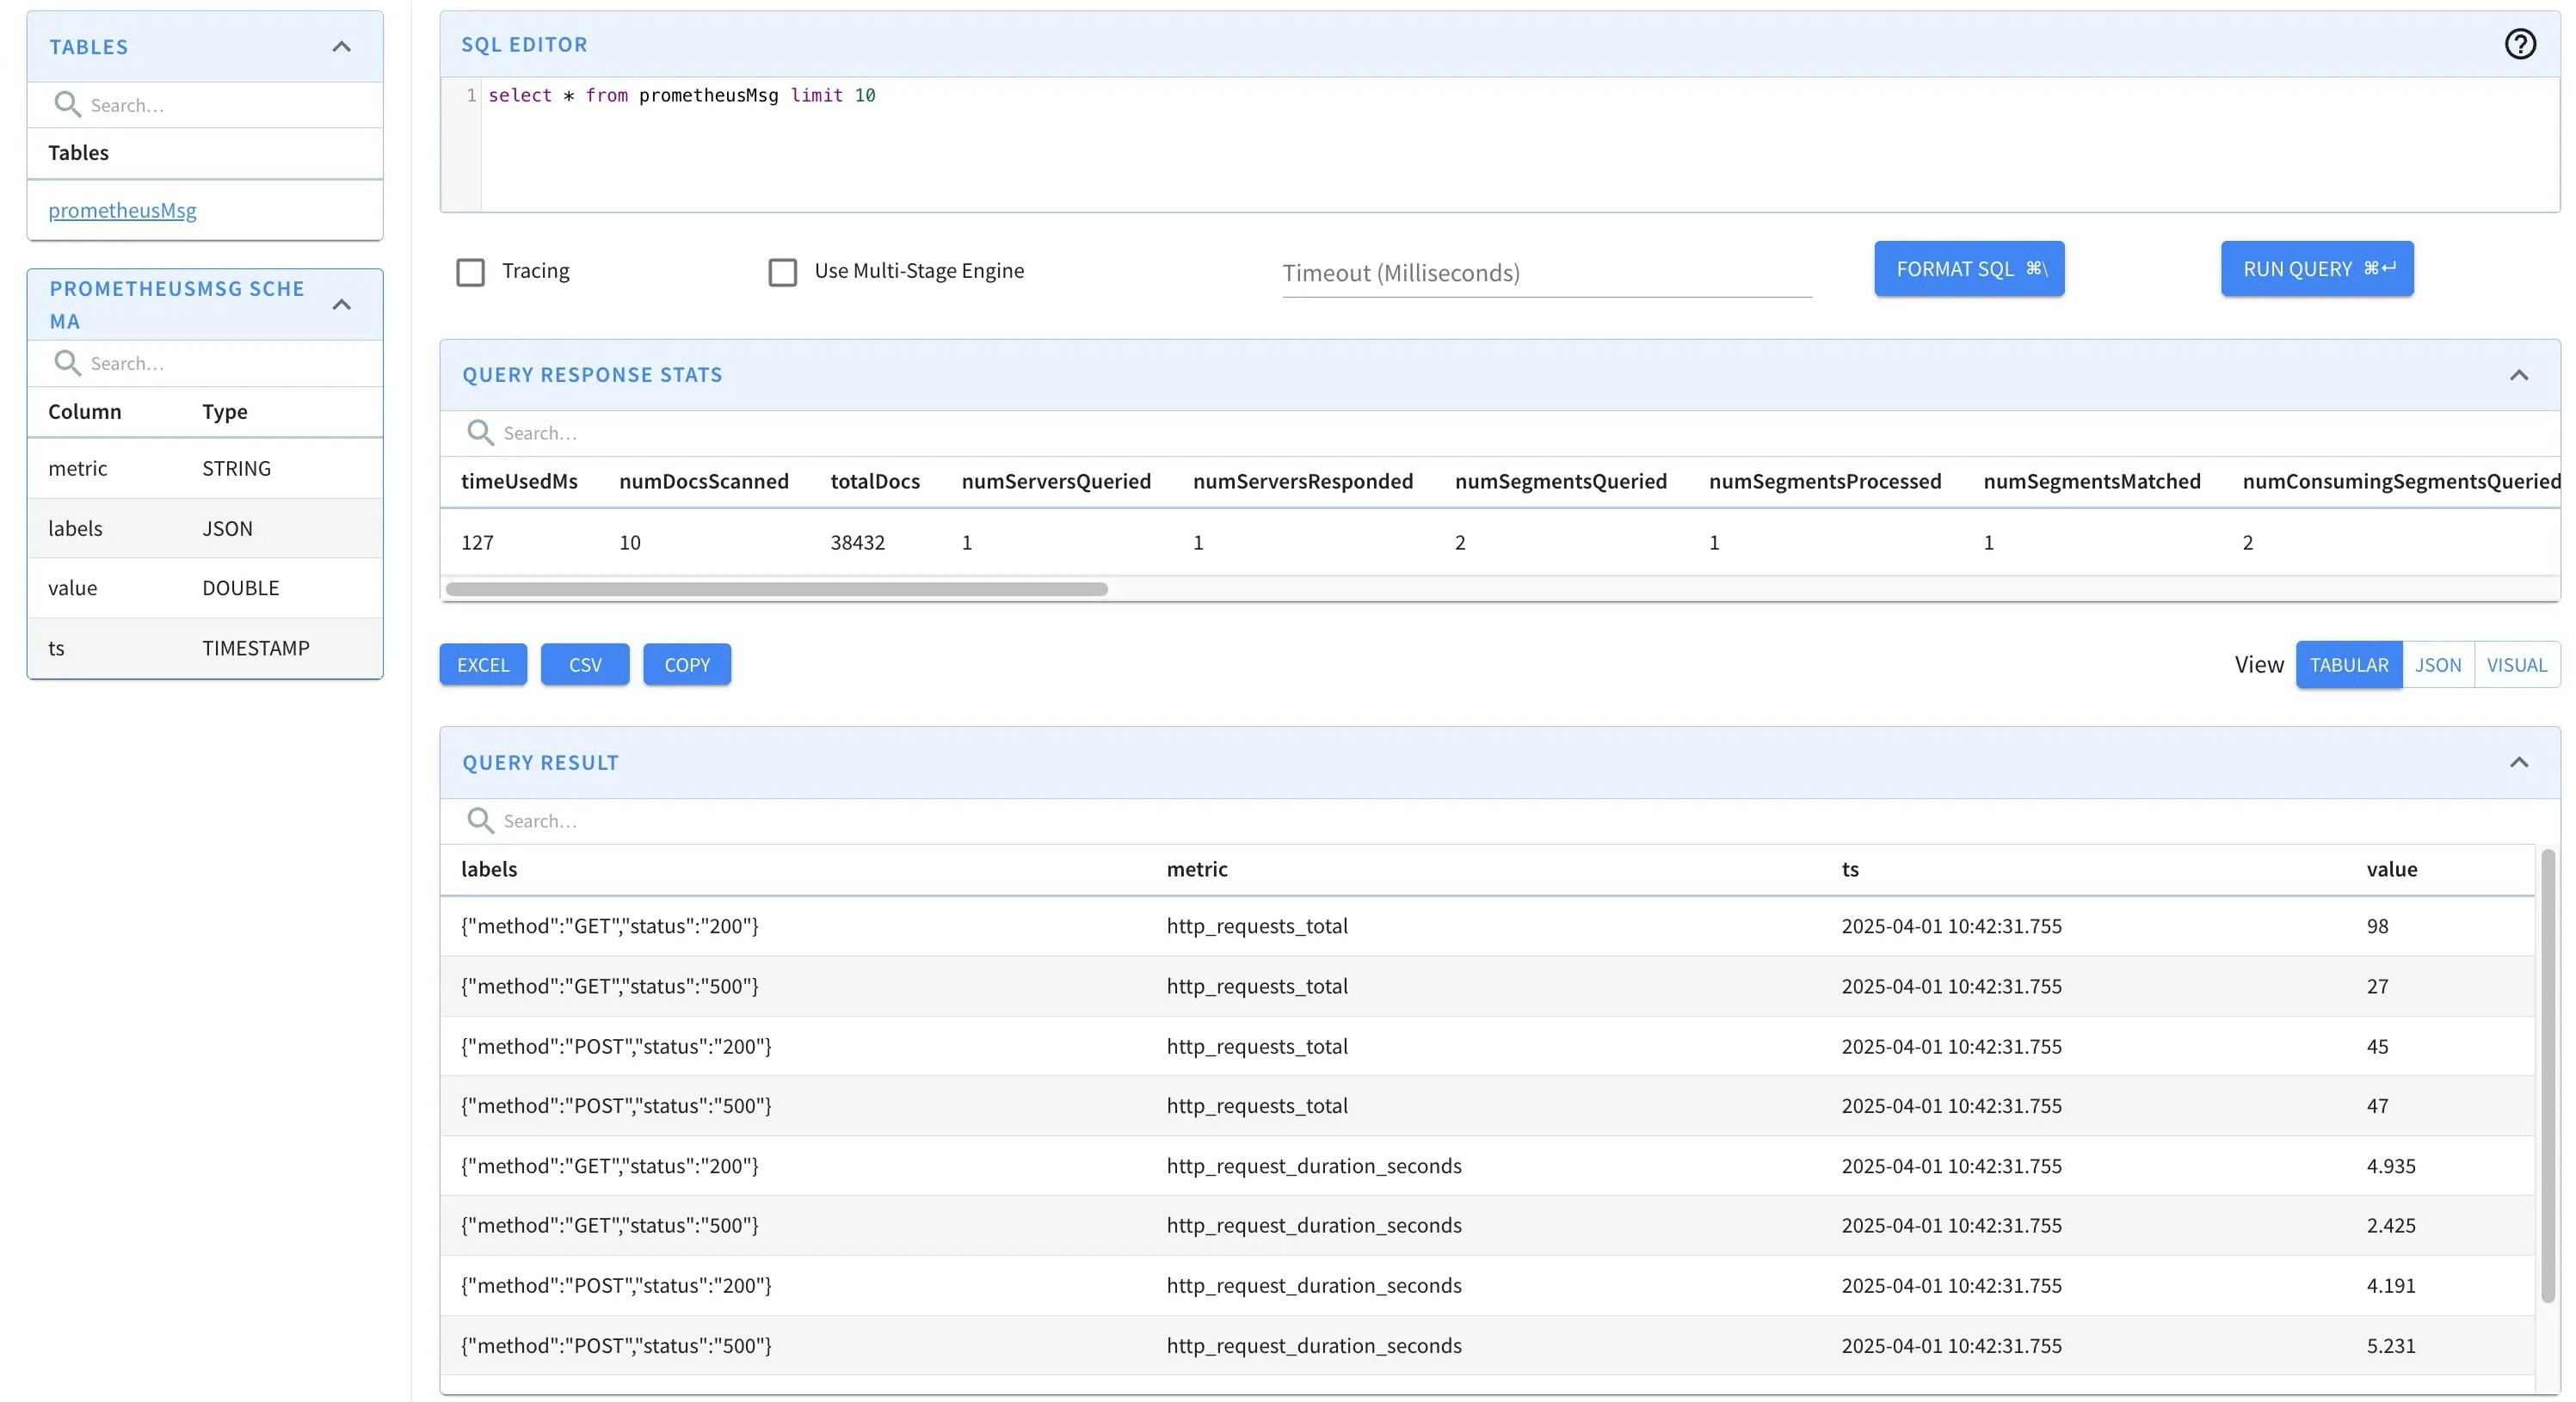
How to Query PromQL Data
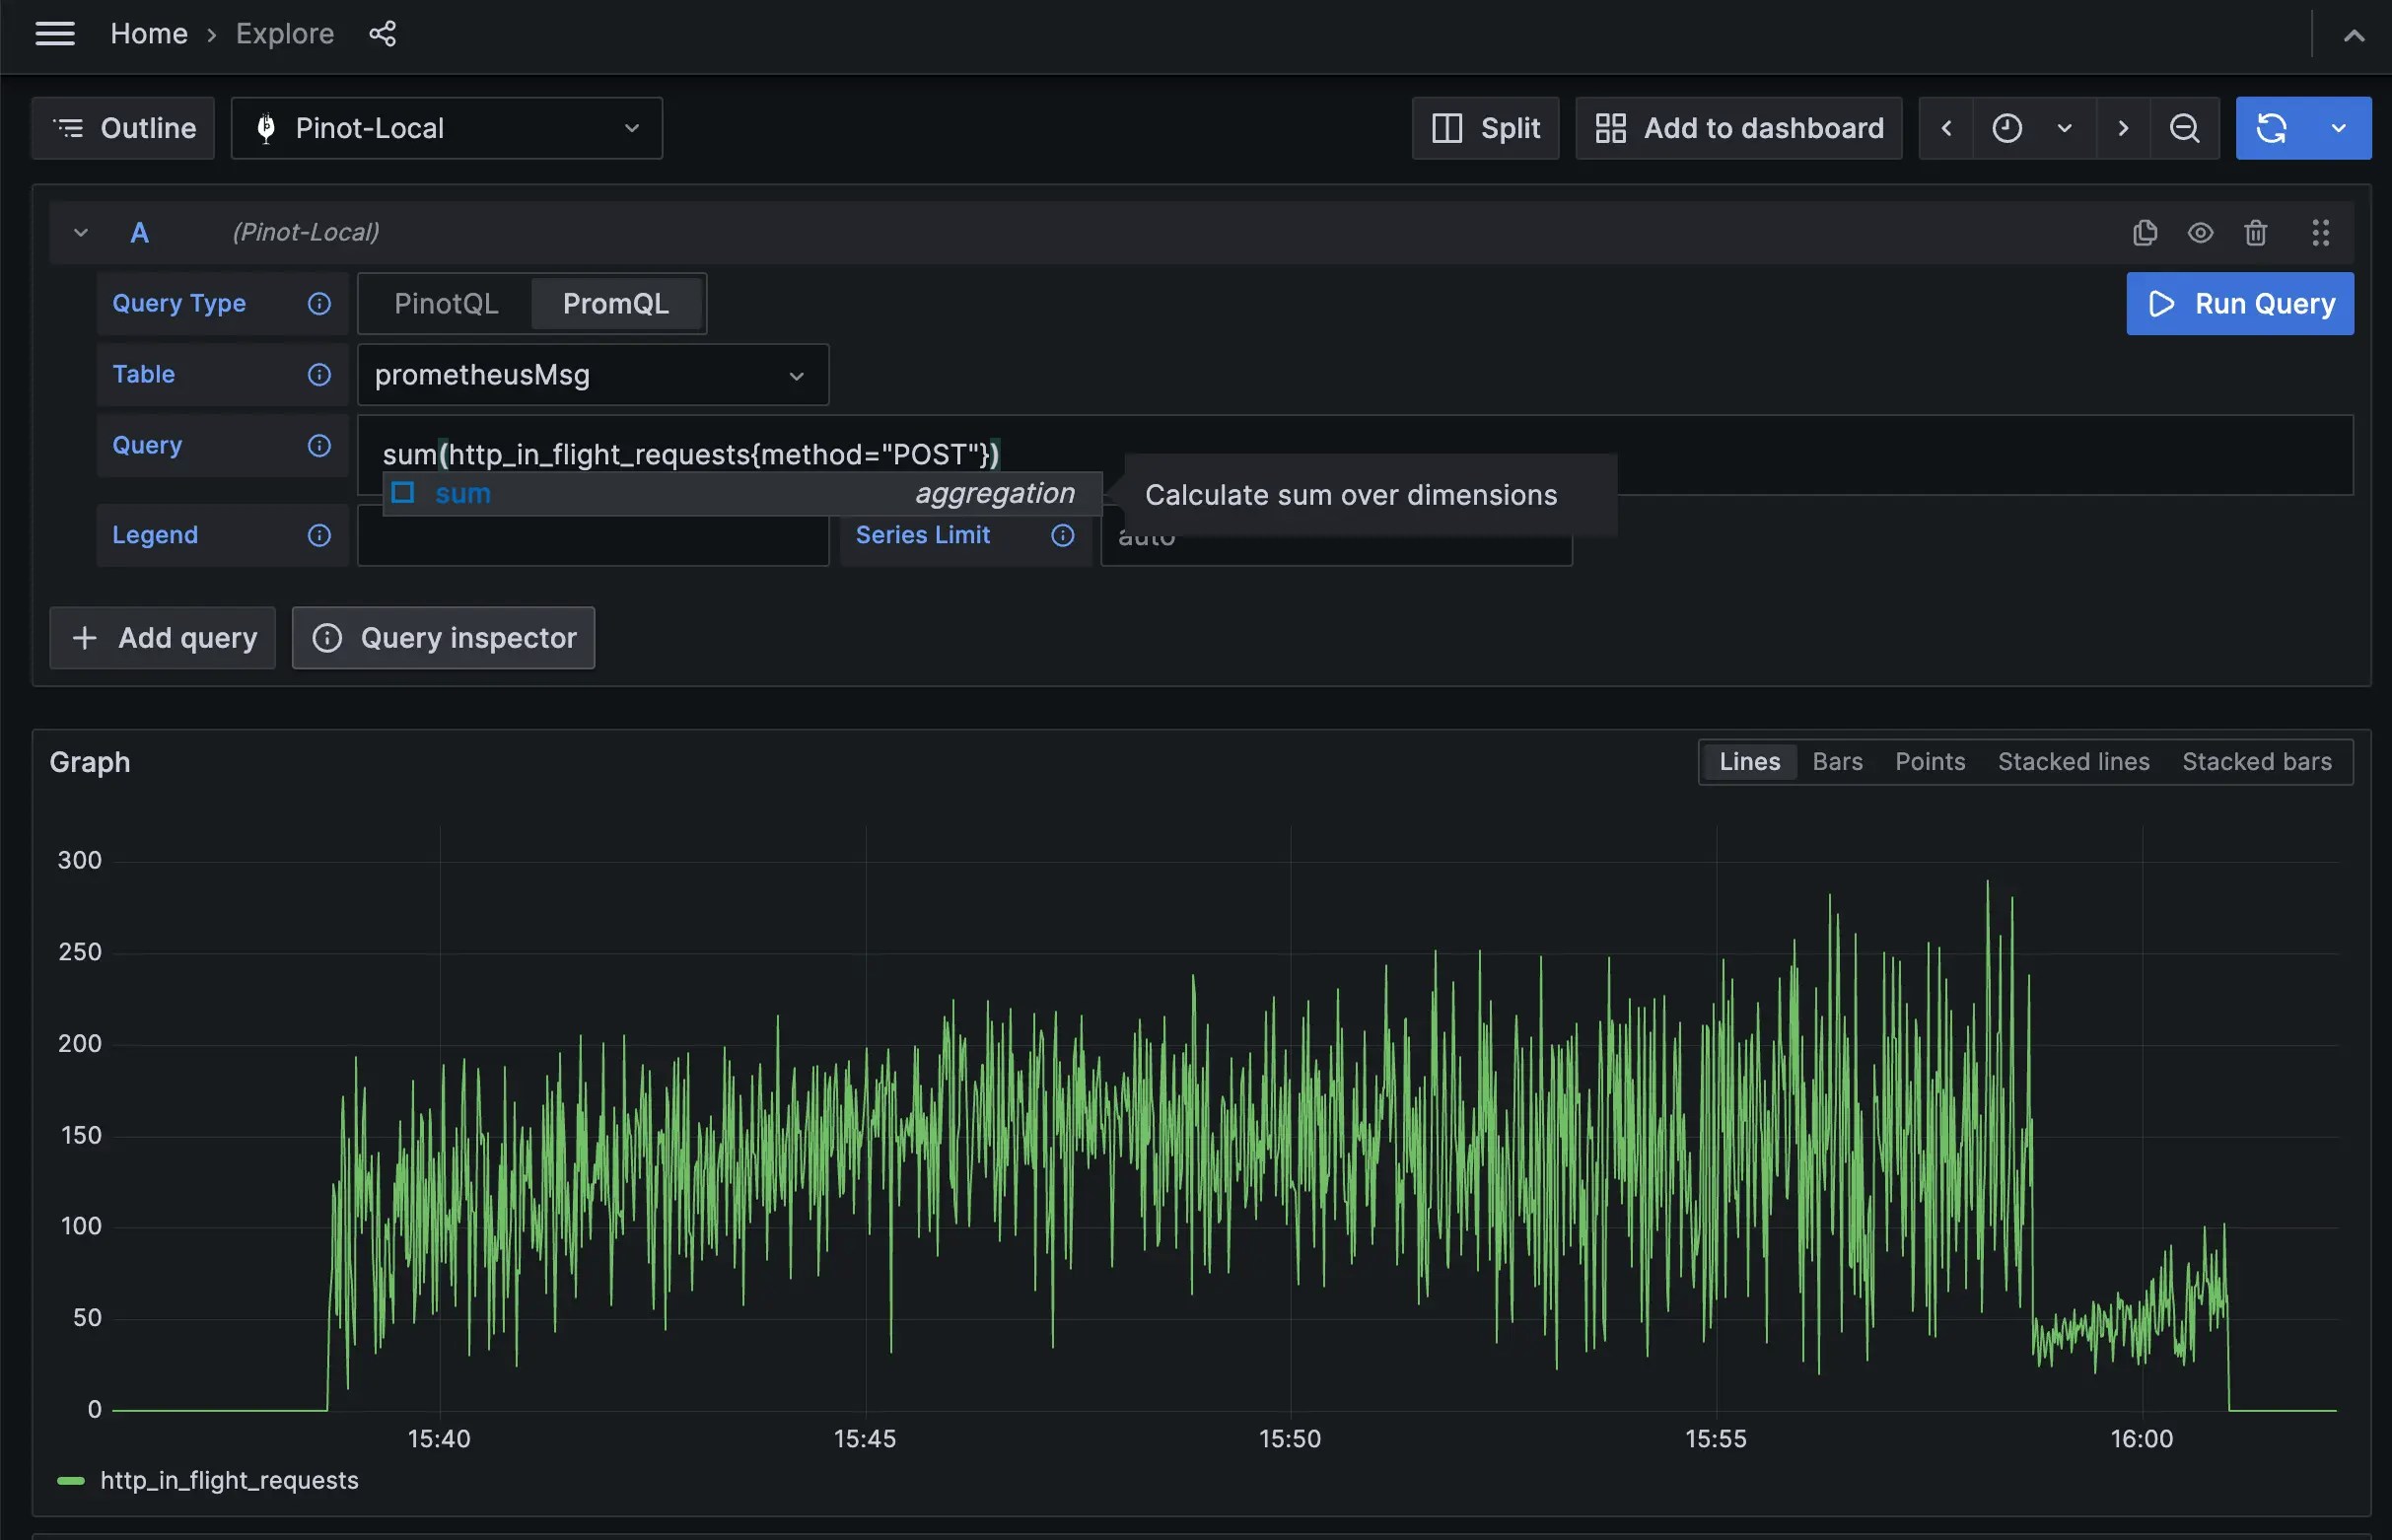
There are two main ways to query PromQL data in Pinot:1. Grafana Pinot Plugin
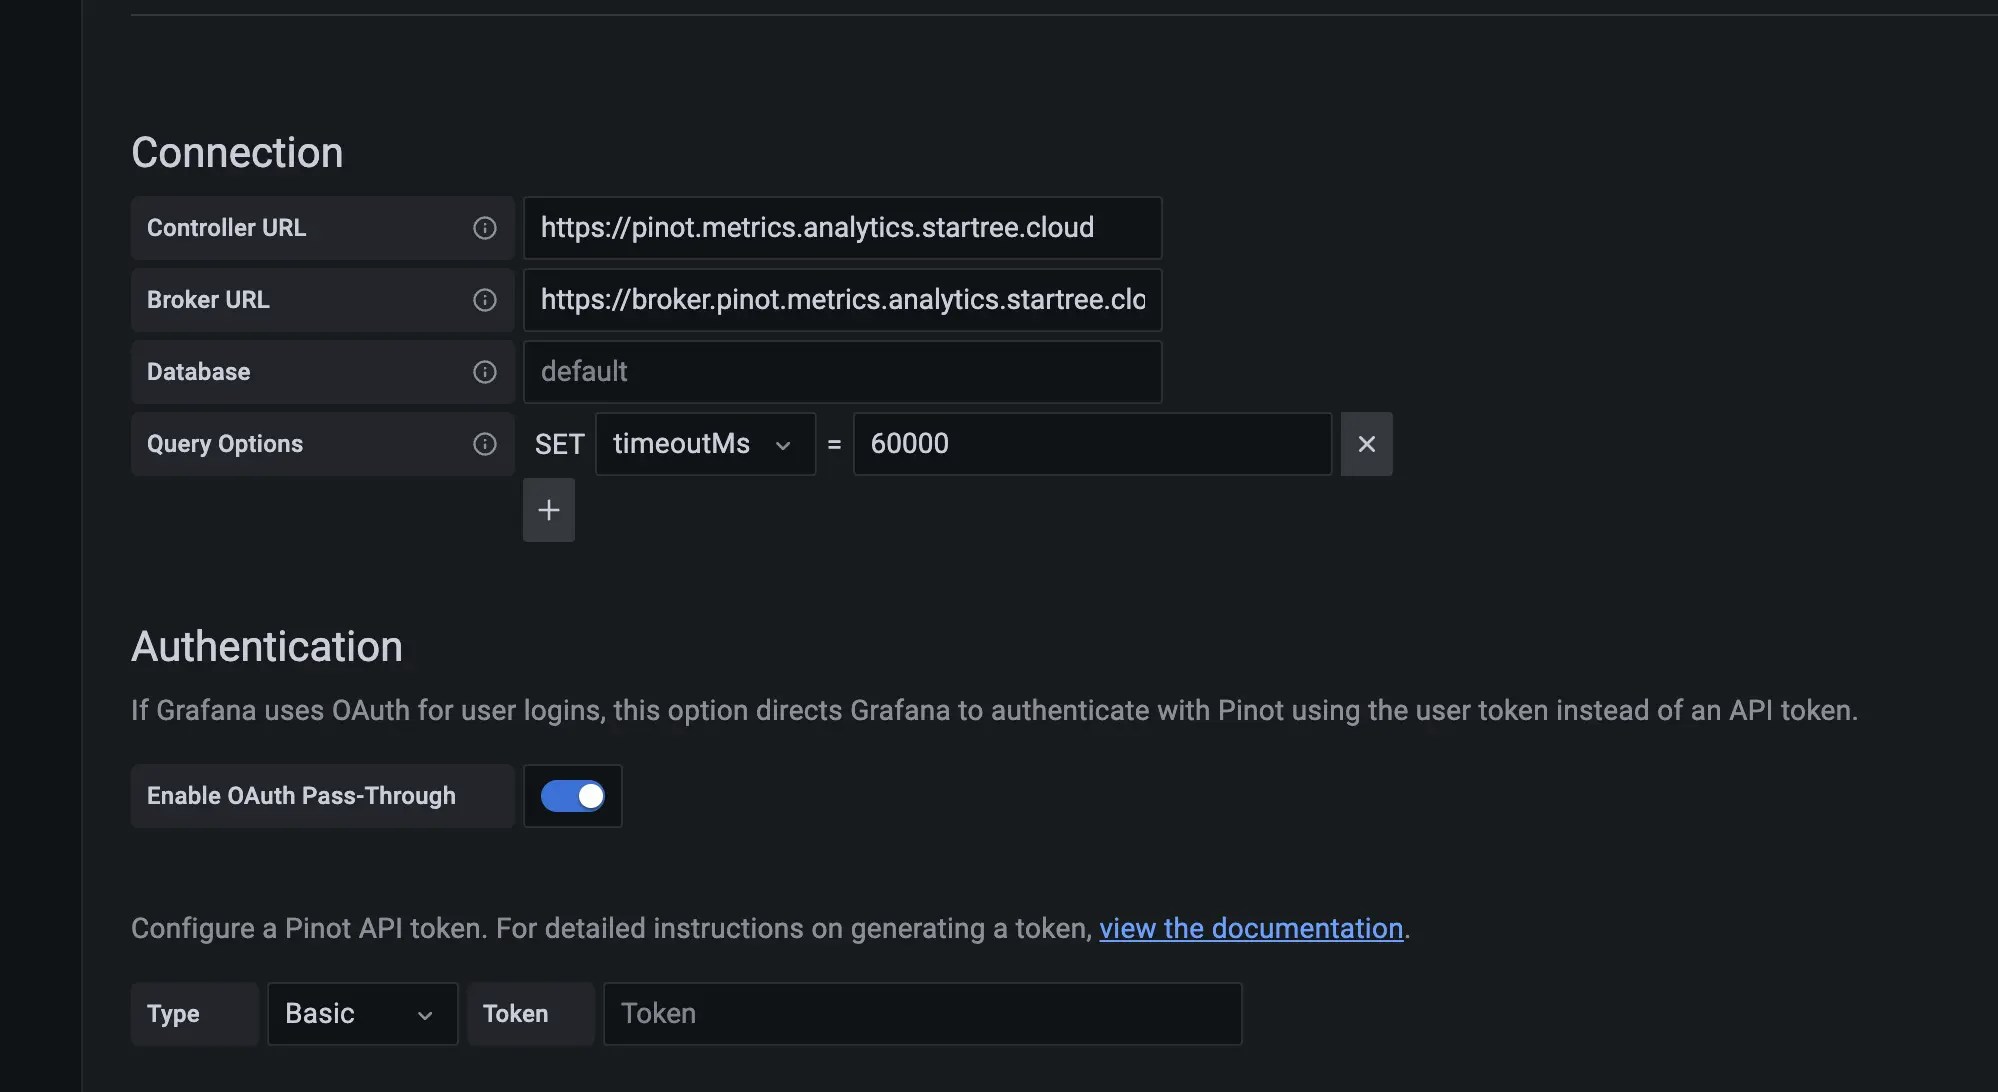
You can query PromQL data using the Grafana Pinot plugin:- Install the Grafana Pinot plugin.
-
Configure your Pinot data source in Grafana.
-
Use the PromQL query editor in your Grafana dashboards.
2. REST API Endpoints
You can query PromQL data using timeseries endpoint:PromQL API endpoint
query: The PromQL expression to evaluate.start: Start timestamp in Unix epoch seconds.end: End timestamp in Unix epoch seconds.step: Query resolution in seconds (interval between data points).language: Query language type (promql).table: Pinot table name containing the metrics data.
Supported PromQL Expressions
Series Selectors
- Query Example:
http_requests_total - Description: Selects time series that match the given metric name.
- Usage: To retrieve multiple time series.
Label Matching and Filtering
-
Query Examples:
-
Operators:
=,!=,=~(regex match),!~(regex not match). - Usage: To narrow down queries to specific metrics or labels.
Offset
- Query Example:
http_requests_total offset 10m - Description: Shifts the time series back or forward in time.
- Usage: To compare current data with past data.
Functions
- Supported Functions:
- Rate:
rate(http_requests_total[5m]) - Increase:
increase(http_requests_total[5m]) - Delta:
delta(http_requests_total[5m]) - Instant Rate:
irate(http_requests_total[5m])
- Rate:
- Usage: To compute rates, changes, and other complex calculations.
Aggregation Operators
- Supported operators:
- Sum:
sum(http_requests_total) - AVG:
avg(http_requests_total) - MAX:
max(http_requests_total) - MIN:
min(http_requests_total) - Count:
count(http_requests_total) - Topk:
topk(1, http_requests_total) - Bottom:
bottomk(2, http_requests_total)
- Sum:
- Usage: To calculate sums, averages, and other metrics across multiple time series.
By and Without Operators
-
Examples:
- Description: Apply aggregation operator by or without labels.
Binary Operators
-
Supported operators:
+,-,*,/ -
Examples:
- Usage: To combine multiple series mathematically.
Only the operators and functions listed above are supported in Pinot, which is a subset of all Prometheus functions and operators.