Claude Desktop Configuration

Configure Claude Desktop to connect with your StarTree MCP Server for natural language analytics.

Prerequisites

Configuration Steps

1. Locate Claude’s Configuration File

macOS

~/Library/Application Support/Claude/claude_desktop_config.json

Windows

%APPDATA%/Claude/claude_desktop_config.json

2. Add MCP Server Configuration

Open the configuration file and add your MCP server entry:

{
  "mcpServers": {
    "pinot_mcp_claude": {
      "command": "/path/to/uv",
      "args": [
        "--directory",
        "/path/to/mcp-pinot",
        "run",
        "mcp_pinot/server.py"
      ],
      "env": {}
    }
  }
}

Replace the paths with your actual system paths:

# Find your uv path
which uv
# Example: /Users/username/.local/bin/uv

# Use absolute path to your mcp-pinot directory
# Example: /Users/username/projects/mcp-pinot

3. Environment Configuration (Optional)

You can include environment variables directly in the configuration instead of using the .env file:

{
  "mcpServers": {
    "pinot_mcp_claude": {
      "command": "/Users/username/.local/bin/uv",
      "args": [
        "--directory",
        "/Users/username/projects/mcp-pinot",
        "run",
        "mcp_pinot/server.py"
      ],
      "env": {
        "PINOT_CONTROLLER_URL": "https://pinot.example.startree.cloud",
        "PINOT_BROKER_HOST": "broker.pinot.example.startree.cloud",
        "PINOT_BROKER_PORT": "443",
        "PINOT_BROKER_SCHEME": "https",
        "PINOT_TOKEN": "Bearer your_token_here",
        "PINOT_DATABASE": "your_workspace_id"
      }
    }
  }
}

4. Restart Claude Desktop

Completely restart Claude Desktop for the configuration to take effect.

5. Verify Connection

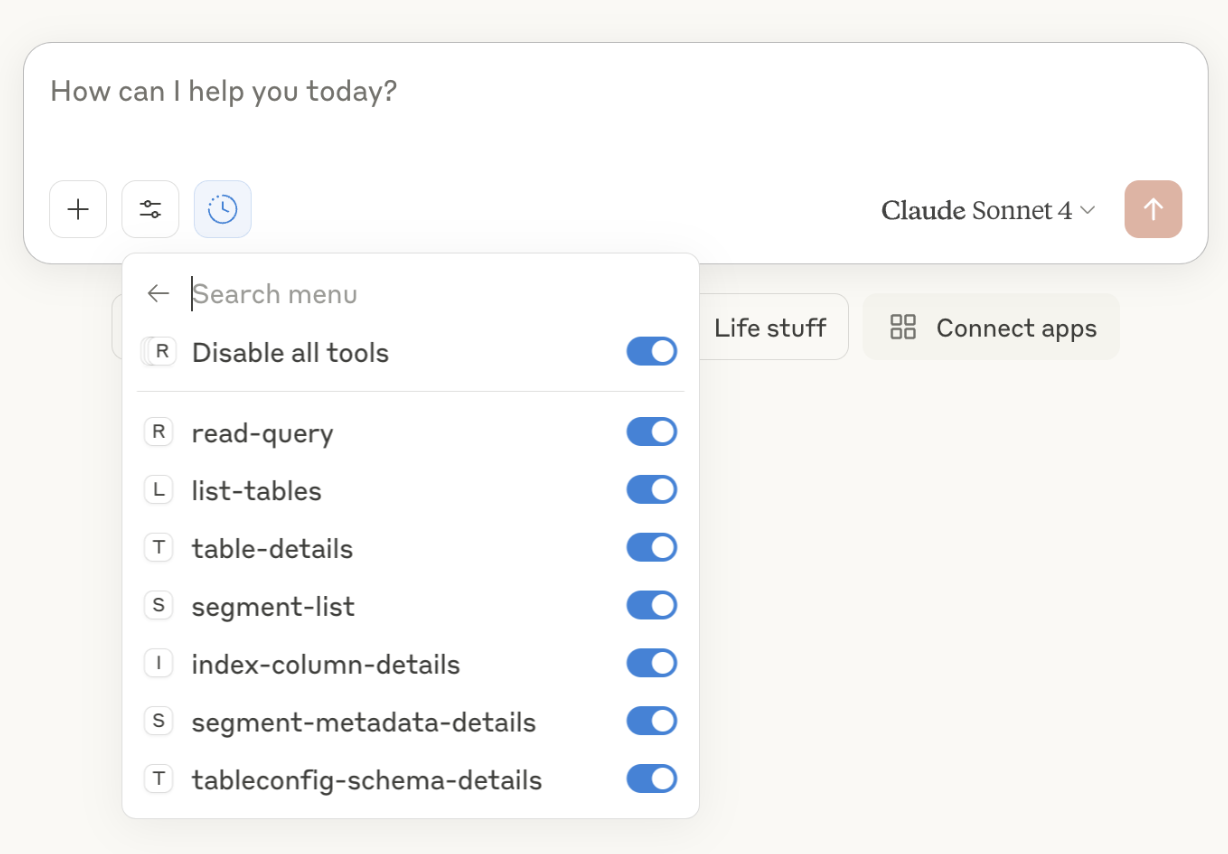
  1. Look for the hammer icon 🛠️ in the Claude chat interface
  2. Click the hammer to see available tools
  3. Verify Pinot tools are listed (list-tables, read-query, etc.)

Start Querying

You’re ready to analyze your data! Try these sample prompts:

Can you help me analyze my data in Pinot? What tables are available?
Can you do a histogram plot on the GitHub events against time?
How many orders were placed in 24 hours on average? Can you help me