

Prerequisites
To follow the code examples in this guide, you must install Docker locally and download recipes.Navigate to recipe
- If you haven’t already, download recipes.
- In terminal, go to the recipe by running the following command:
Launch Pinot Cluster
You can spin up a Pinot Cluster by running the following command:Pinot Schema and Tables
Now let’s create a Pinot Schema, as well as real-time and offline tables. Pinot is going to take care of populating data into the offline table, but it still expects us to configure the table.Schema
Our schema is going to capture some simple events, and looks like this:Offline Table
The offline table config is defined below:Real-Time Table
And the real-time table is defined below:RealtimeToOfflineSegmentsTask, which is extracted below:
bufferTimePeriod- Tasks won’t be scheduled unless the time window is older than this buffer.bucketTimePeriod- The time window size/amount of data processed for each run.
roundBucketTimePeriod- Round the time value before merging rows in the offline table. The value of1mthat we’ve used means that values in thetscolumn will be rounded to the nearest column.mergeType- The type of aggregation to apply when creating rows in the offline table. Valid values are:concat- Don’t aggregate anything.rollup- Perform metric aggregations across common dimensions and time.dedup- Deduplicate rows that have the same values.
{metricName}.aggregationType- Aggregation function to apply to the metric for aggregations. Only applicable forrollup. Allowed values aresum,max, andmin. We are selecting themaxvalue for thecountcolumn.maxNumRecordsPerSegment- The number of records to include in a segment.
Ingesting Data
Let’s ingest data into theevents Kafka topic, by running the following:
Scheduling the RT2OFF Job
The Real-Time to Offline Job can be scheduled automatically via the real-time table config or manually via the REST API. We can trigger it manually by running the following command:Output
We can then check the Pinot Controller logs to see that it’s been triggered:
Output
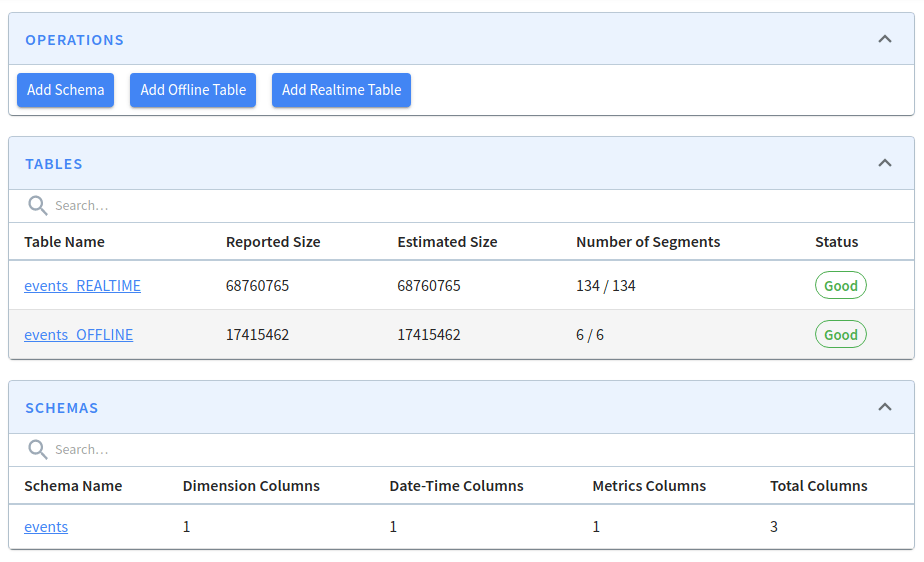
Let’s run the job a few times and then navigate to localhost:9000/#/tables.
You’ll see the following:
Time Boundary
The data written to segments in offline tables won’t immediately be seen in query results. When a query is received by Pinot Brokers, the broker sends a time boundary annotated version of the query to the offline and real-time tables.For more explanation about how the time boundary is computed, see Time Boundary.
ingestionConfig.batchIngestionConfig.segmentIngestionFrequency in our offline table:
- If it’s set to
HOURLY, thentimeBoundary = Maximum end time of offline segments - 1 HOUR - Otherwise,
timeBoundary = Maximum end time of offline segments - 1 DAY
You can check the time boundary of a table by querying the HTTP API on the Pinot Broker, as shown in How to work out the time boundary in hybrid tables
1646661240000 or 2022-03-07T13:54:00 in a more friendly format.
This value will increase in increments of 5 minutes every time that the RT2OFF job runs as we set bucketTimePeriod to 5m.
You can increase this value in the real-time table config to have the job process more data.
If we temporarily pause the ingestion, we can check what queries are actually getting executed on each table.
Let’s say we run the following query to count the number of records:
Query Results
Behind the scenes, the broker sends the following queries to the server:
The first time that you run this query it may return no records since the time stamp will be at least an hour ago and the data in the offline segments will probably be more recent than that.
Query Results
Query Results
So it does seem like the query results are combining the offline and real-time tables.
This becomes clearer if we write a query that returns the most common timestamps:
Query Results
Recall that when we created offline segments we were rolling up timestamps to the nearest minute, which means that we now have a lot of events with the same timestamp.