> ## Documentation Index
> Fetch the complete documentation index at: https://docs.startree.ai/llms.txt
> Use this file to discover all available pages before exploring further.
# How to perform root cause analysis
Before you perform the actions on this page, you must have configured a data source, data set, and created an alert.
In this guide we learn how to perform root cause analysis.
## Find anomalies
First, find an anomaly to investigate.
If you received an anomaly email you can skip to the [anomaly chart](#anomaly-chart) section of this guide.
Click on the tab on the left menu to view all anomalies. You should see the following screen:
 Select an anomaly by clicking on the anomaly in the `Name` column. You should then see the following screen:
 An anomaly
At the top of the screen is a calendar control that we can use to control the date range shown on the screen.
 Date range selection
Below is a summary of the anomaly showing a chart of varied values over time.
 Anomaly Summary
Finally we have a heatmap at the bottom of the screen that allows us to drill down into the data based on various properties.
 Heatmap
## Anomaly chart
Let's have a look at how to use the anomaly chart. The animation below shows how to use the various controls:
 Investigating the anomaly chart
You can update the chart to include add or remove anomalies, upper and lower bounds, as well as the values themselves. You can also zoom in to specific parts of the chart to do further investigation, as shown in the animation below:
 Investigating the anomaly chart
## Heatmap
Next let's have a look at how to use the heatmap. The heatmap shows how the data has changed compared to the same period seven days ago. You can then drill down by each property to see the current value and the percentage change, as shown in the animation below.
 Investigating the heatmap
In this example, there's been a significant decrease in page views for the Chrome browser. Our next step is to determine what's changed, causing Chrome's page views to decrease.
## Events
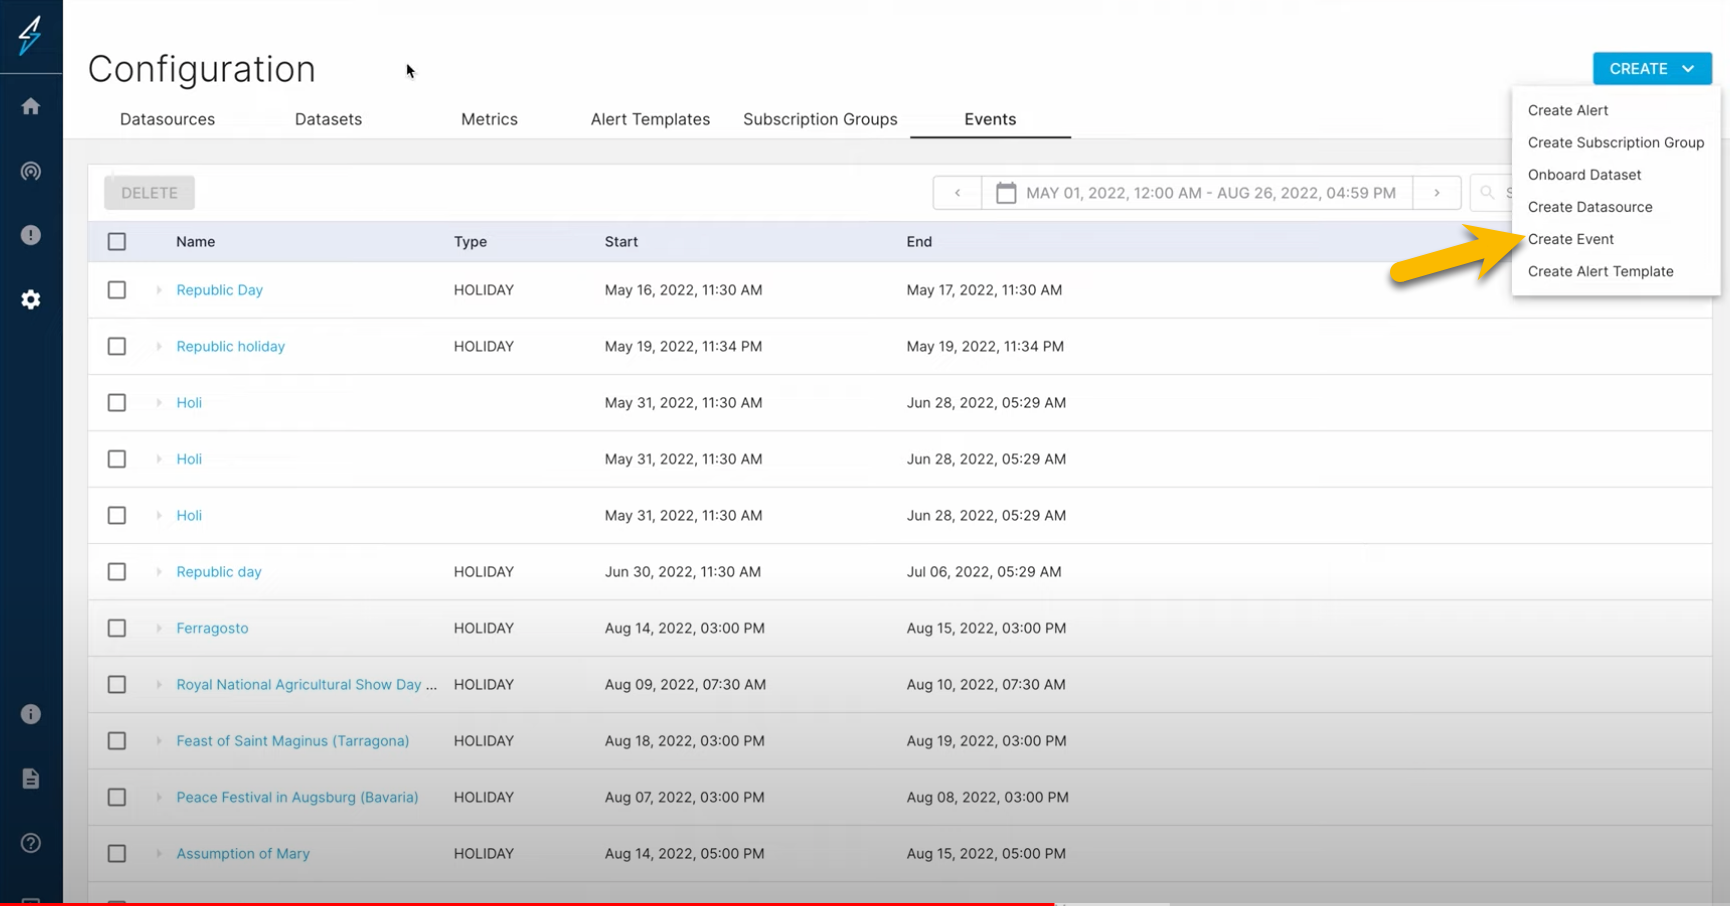
You could also ingest events like holiday events and code check-ins, for example, to ThirdEye. Let's have a look at how to create an event.
To view your events, click on the **Events** tab on your Configuration page. You would then see your list of events.
 Investigating related events
If you do not have events and want to create an event, click on the **Create** dropdown button and select **Create Event**. For ingesting events in bulk, you could view our API Swagger documentation for available Event API routes to configure event ingestion.