> ## Documentation Index
> Fetch the complete documentation index at: https://docs.startree.ai/llms.txt
> Use this file to discover all available pages before exploring further.
# Create your First Alert
You must install ThirdEye before you begin.
Alerts are the rules you build to detect anomalies. An alert configuration contains all the information necessary to:
* Fetch data from a datasource
* Preprocess data
* Compute baselines
* Detect anomalies
* Filter anomalies with business rules
* Send alerts to your subscription groups
In this guide, we'll create an alert that detects when a metric lies outside of a defined range. We will use StarTree Cloud, which includes Apache Pinot hosted as software-as-a-service (SaaS).
## Load a sample dataset
To begin, load data into Apache Pinot.
Use StarTree Data Manager to load data.
1. Go to your StarTree Data Manager at `data.your.instance.startree.cloud`.
2. Click **Create a Dataset**.
3. In Sample Datasets, click **Complex Website**.
4. Set the name to `complexWebsite`, and then click **Confirm**.
The test dataset is now loaded into Pinot.
## Set up the datasource
Configure ThirdEye to get access to the Pinot database.
Connect ThirdEye to Pinot. In StarTree Cloud, ThirdEye connects to the Pinot database automatically. The first time ThirdEye is opened, a page will guide you through the onboarding of the dataset. Ask StarTree support for help if you cannot see Pinot datasets or fail to onboard.
## Create the alert configuration
1. In StarTree Cloud, open the Thirdeye app.
2. Click **Create Alert**.
3. Copy and paste this JSON in the configuration field:
Use this JSON to configure your alert.
```json theme={null}
{
"name": "my-first-detection-configuration",
"description": "",
"cron": "0 0 5 ? * * *",
"template": {
"name": "startree-threshold"
},
"templateProperties": {
"dataSource": "pinot",
"dataset": "complexWebsite",
"aggregationFunction": "sum",
"aggregationColumn": "views",
"max": "15000",
"min": "5000",
"monitoringGranularity": "P1D"
}
}
```
*quickstart\_complexWebsite\_alert.json*
This configuration uses the `startree-threshold` template. A template contains all the logic to perform a detection, and exposes configuration fields. Properties are configured in `templateProperties`.
With this configuration, the following logic is applied:
* An SQL query returns the sum of views, grouped by day, from the `complexWebSite` table.
* A threshold rule is applied to the query results. If a data point falls outside the thresholds, it is flagged as an anomaly.
For more information about alert configuration, see [understanding detection configuration](/thirdeye/alert-configuration).
4. Below the JSON configuration, in the preview panel, press the refresh button: you will see the result of the detection configuration. Notice that there are a few anomalies.
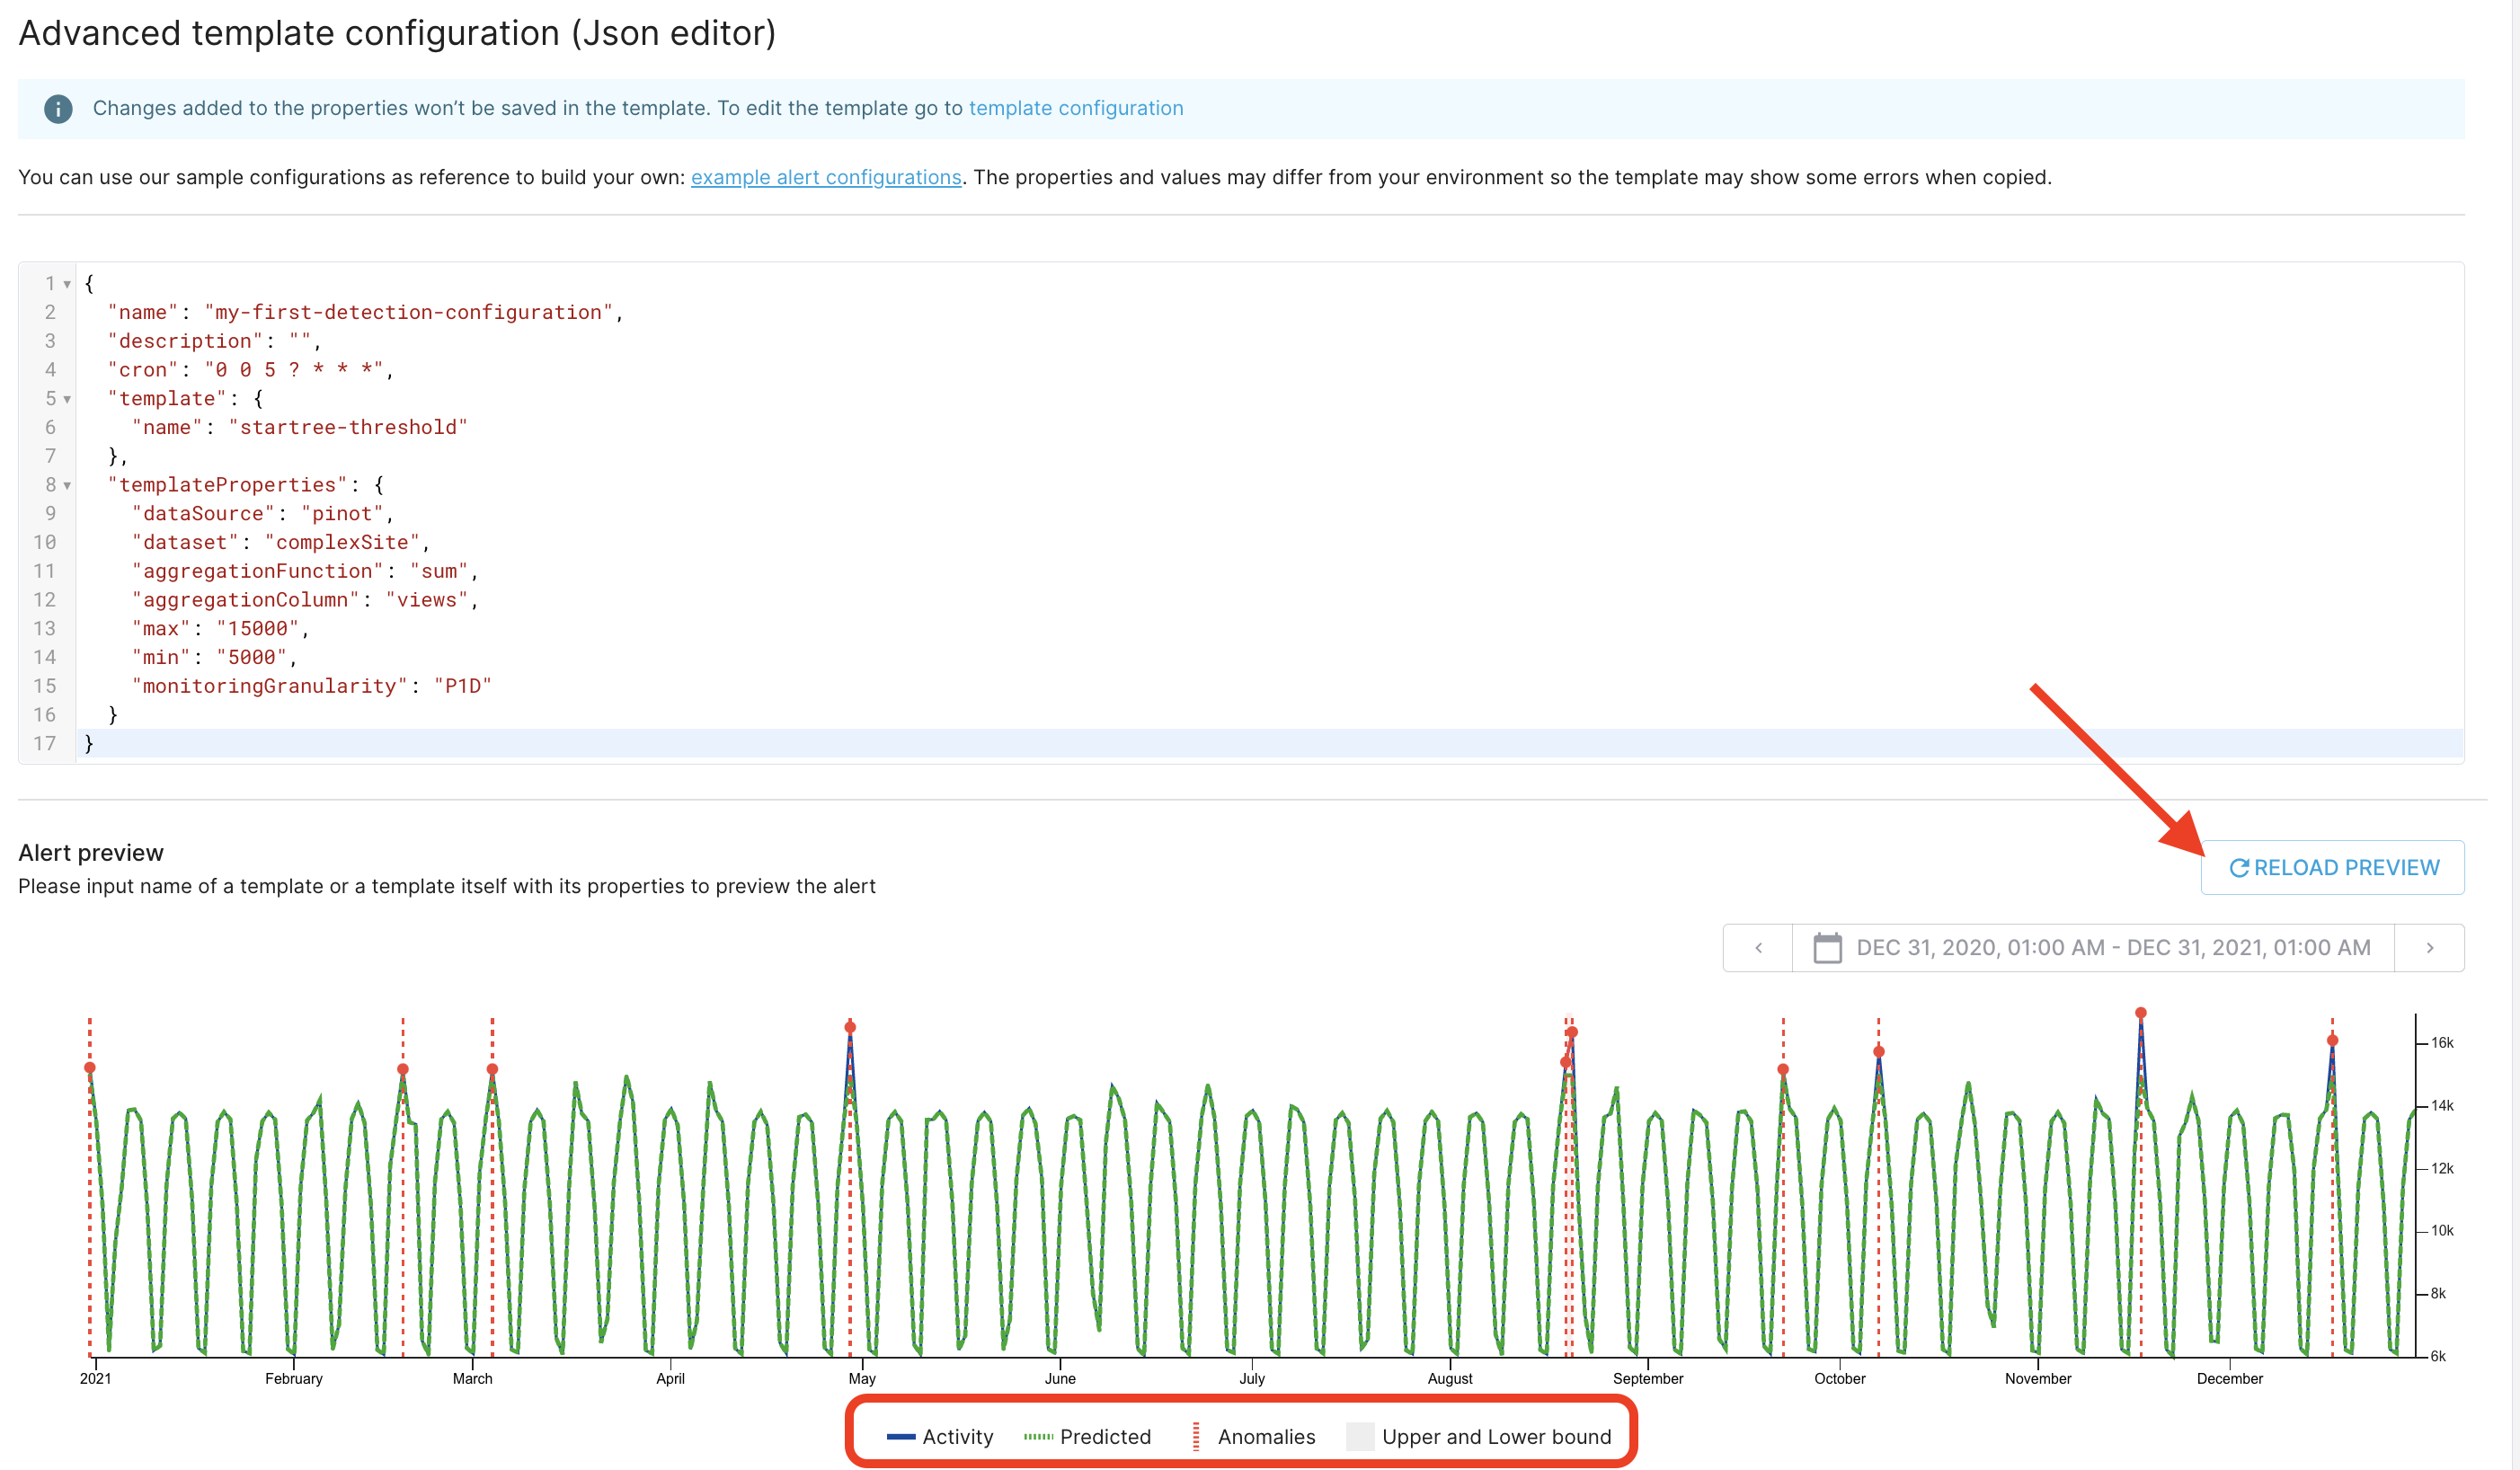 Try changing the dates on the timeframe selector in the top right corner and the min/max values in the JSON to see what happens. Click the legend fields at the bottom to show/hide timeseries.
5. (Optional) Use the notifications panel below the chart to send anomaly messages to external systems like Slack and email. To create a notification, click **Create Alert**.
ThirdEye will guide you through the process, helping you find the right algorithm for your data. Once you get to the end and click **Create**, your first alert is created, and you will be redirected to the alert page.
When an alert is created, the detection is rerun on past data. It may take a few seconds,
so you may have to refresh the page.
## View an anomaly
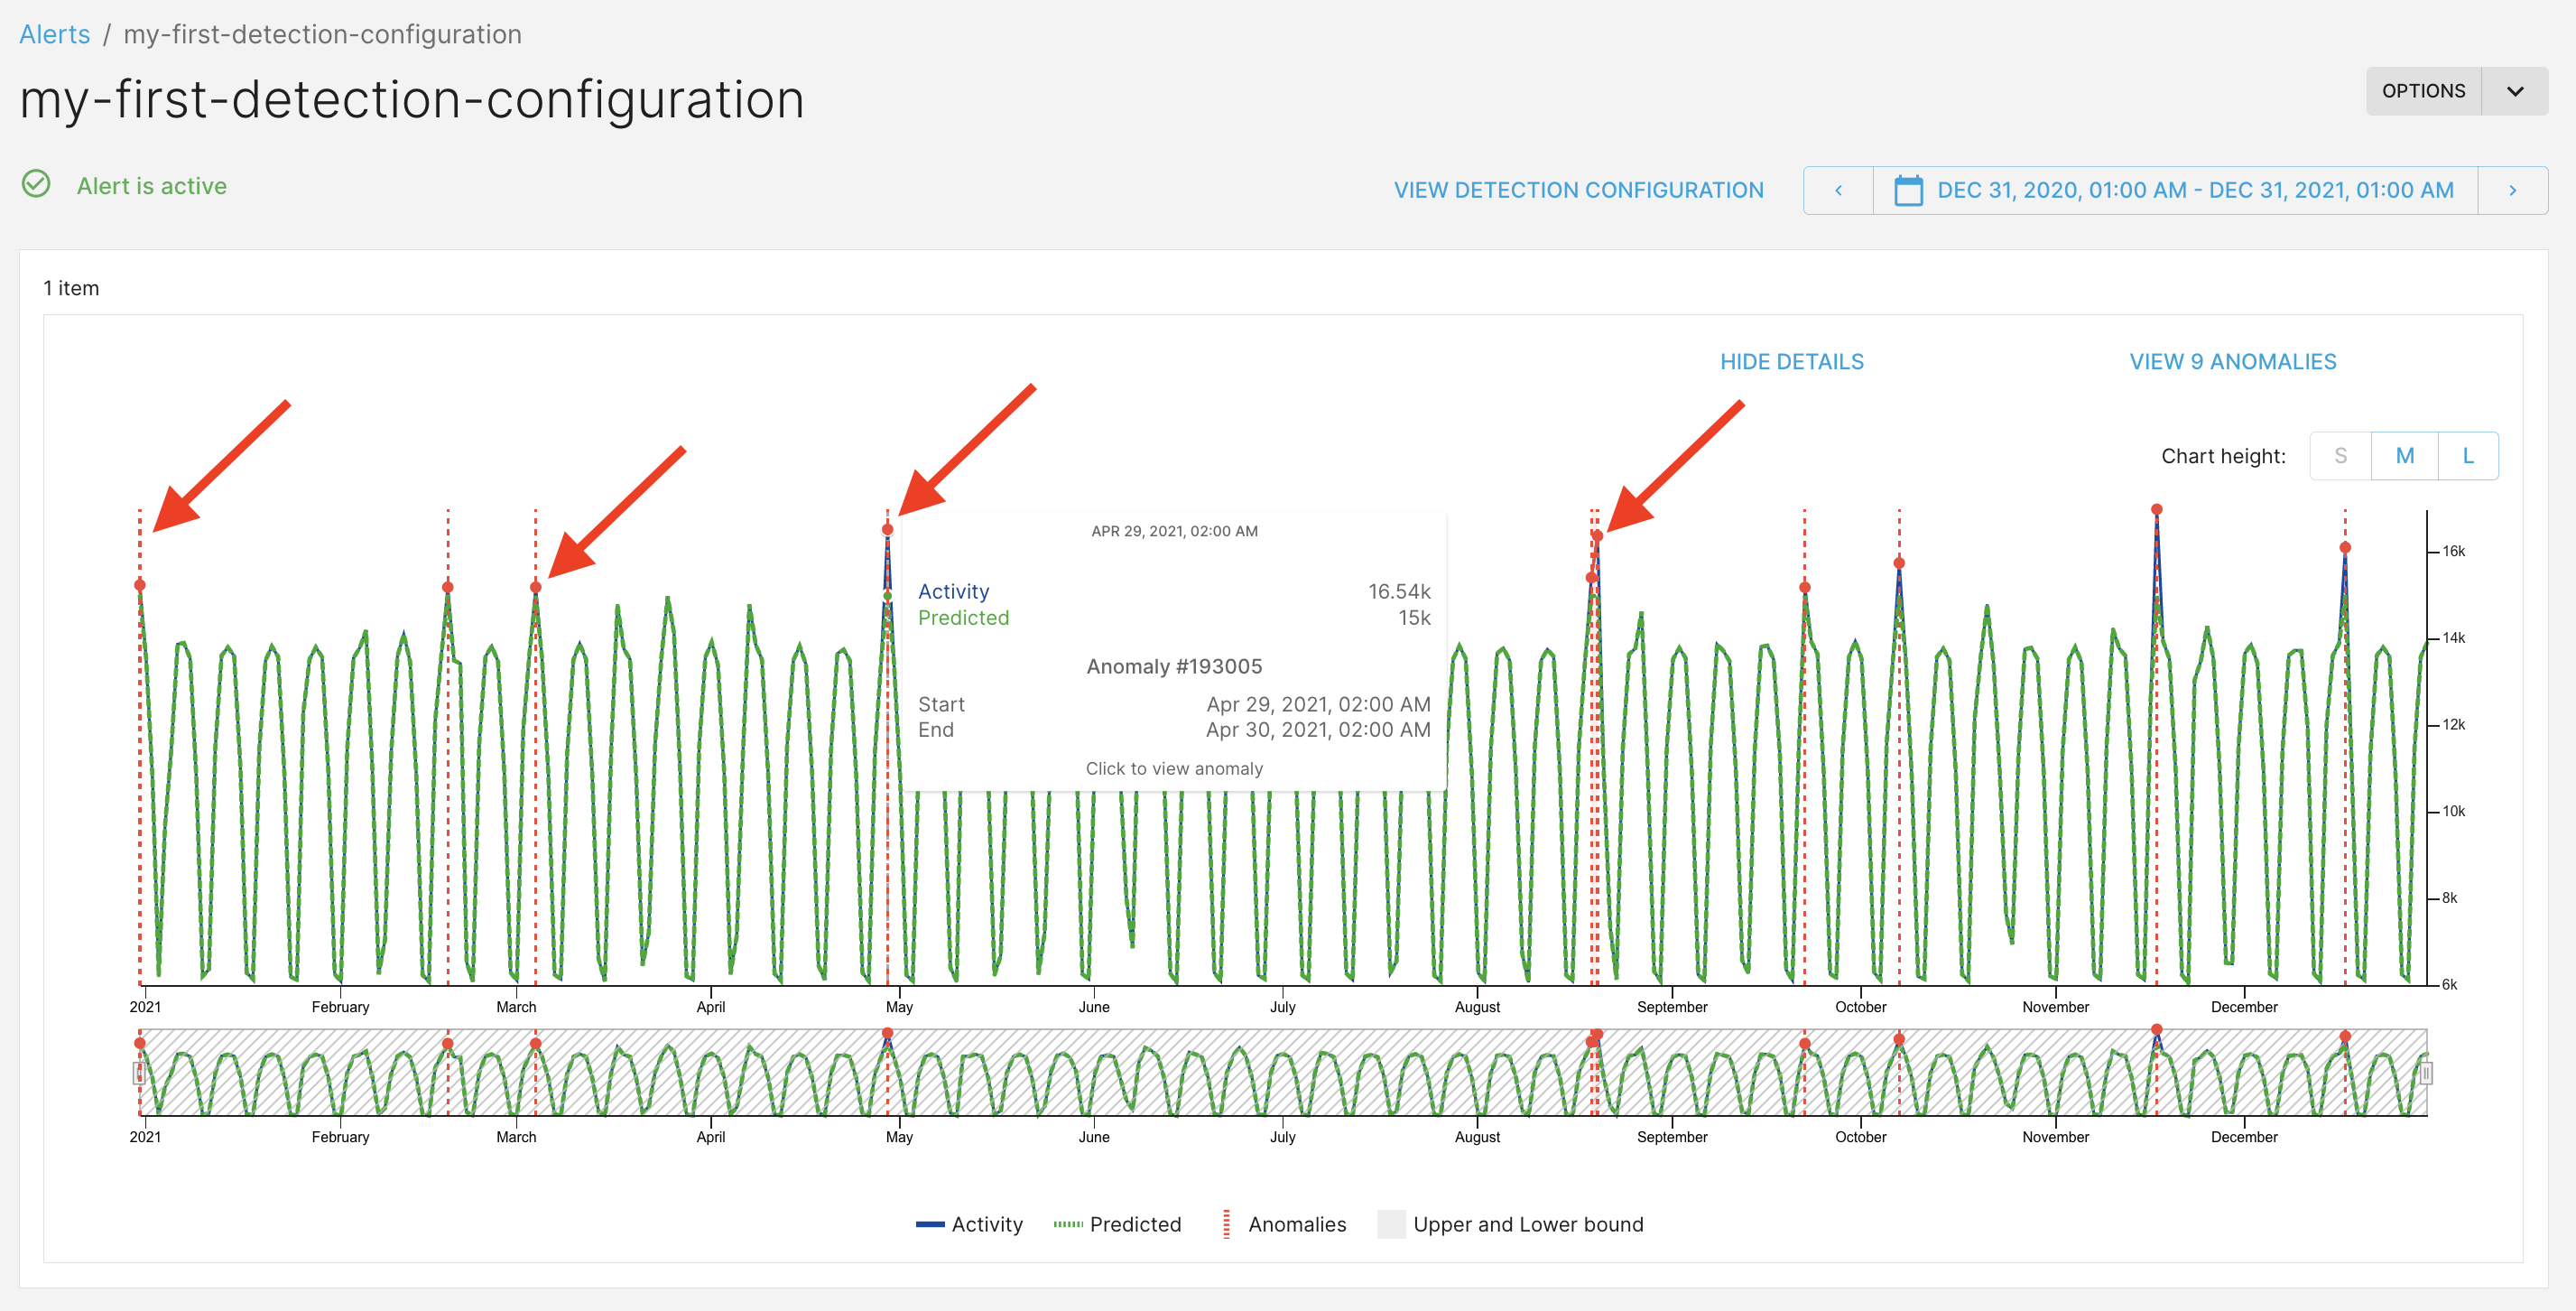
1. Click an anomaly to open the anomaly page.
Try changing the dates on the timeframe selector in the top right corner and the min/max values in the JSON to see what happens. Click the legend fields at the bottom to show/hide timeseries.
5. (Optional) Use the notifications panel below the chart to send anomaly messages to external systems like Slack and email. To create a notification, click **Create Alert**.
ThirdEye will guide you through the process, helping you find the right algorithm for your data. Once you get to the end and click **Create**, your first alert is created, and you will be redirected to the alert page.
When an alert is created, the detection is rerun on past data. It may take a few seconds,
so you may have to refresh the page.
## View an anomaly
1. Click an anomaly to open the anomaly page.
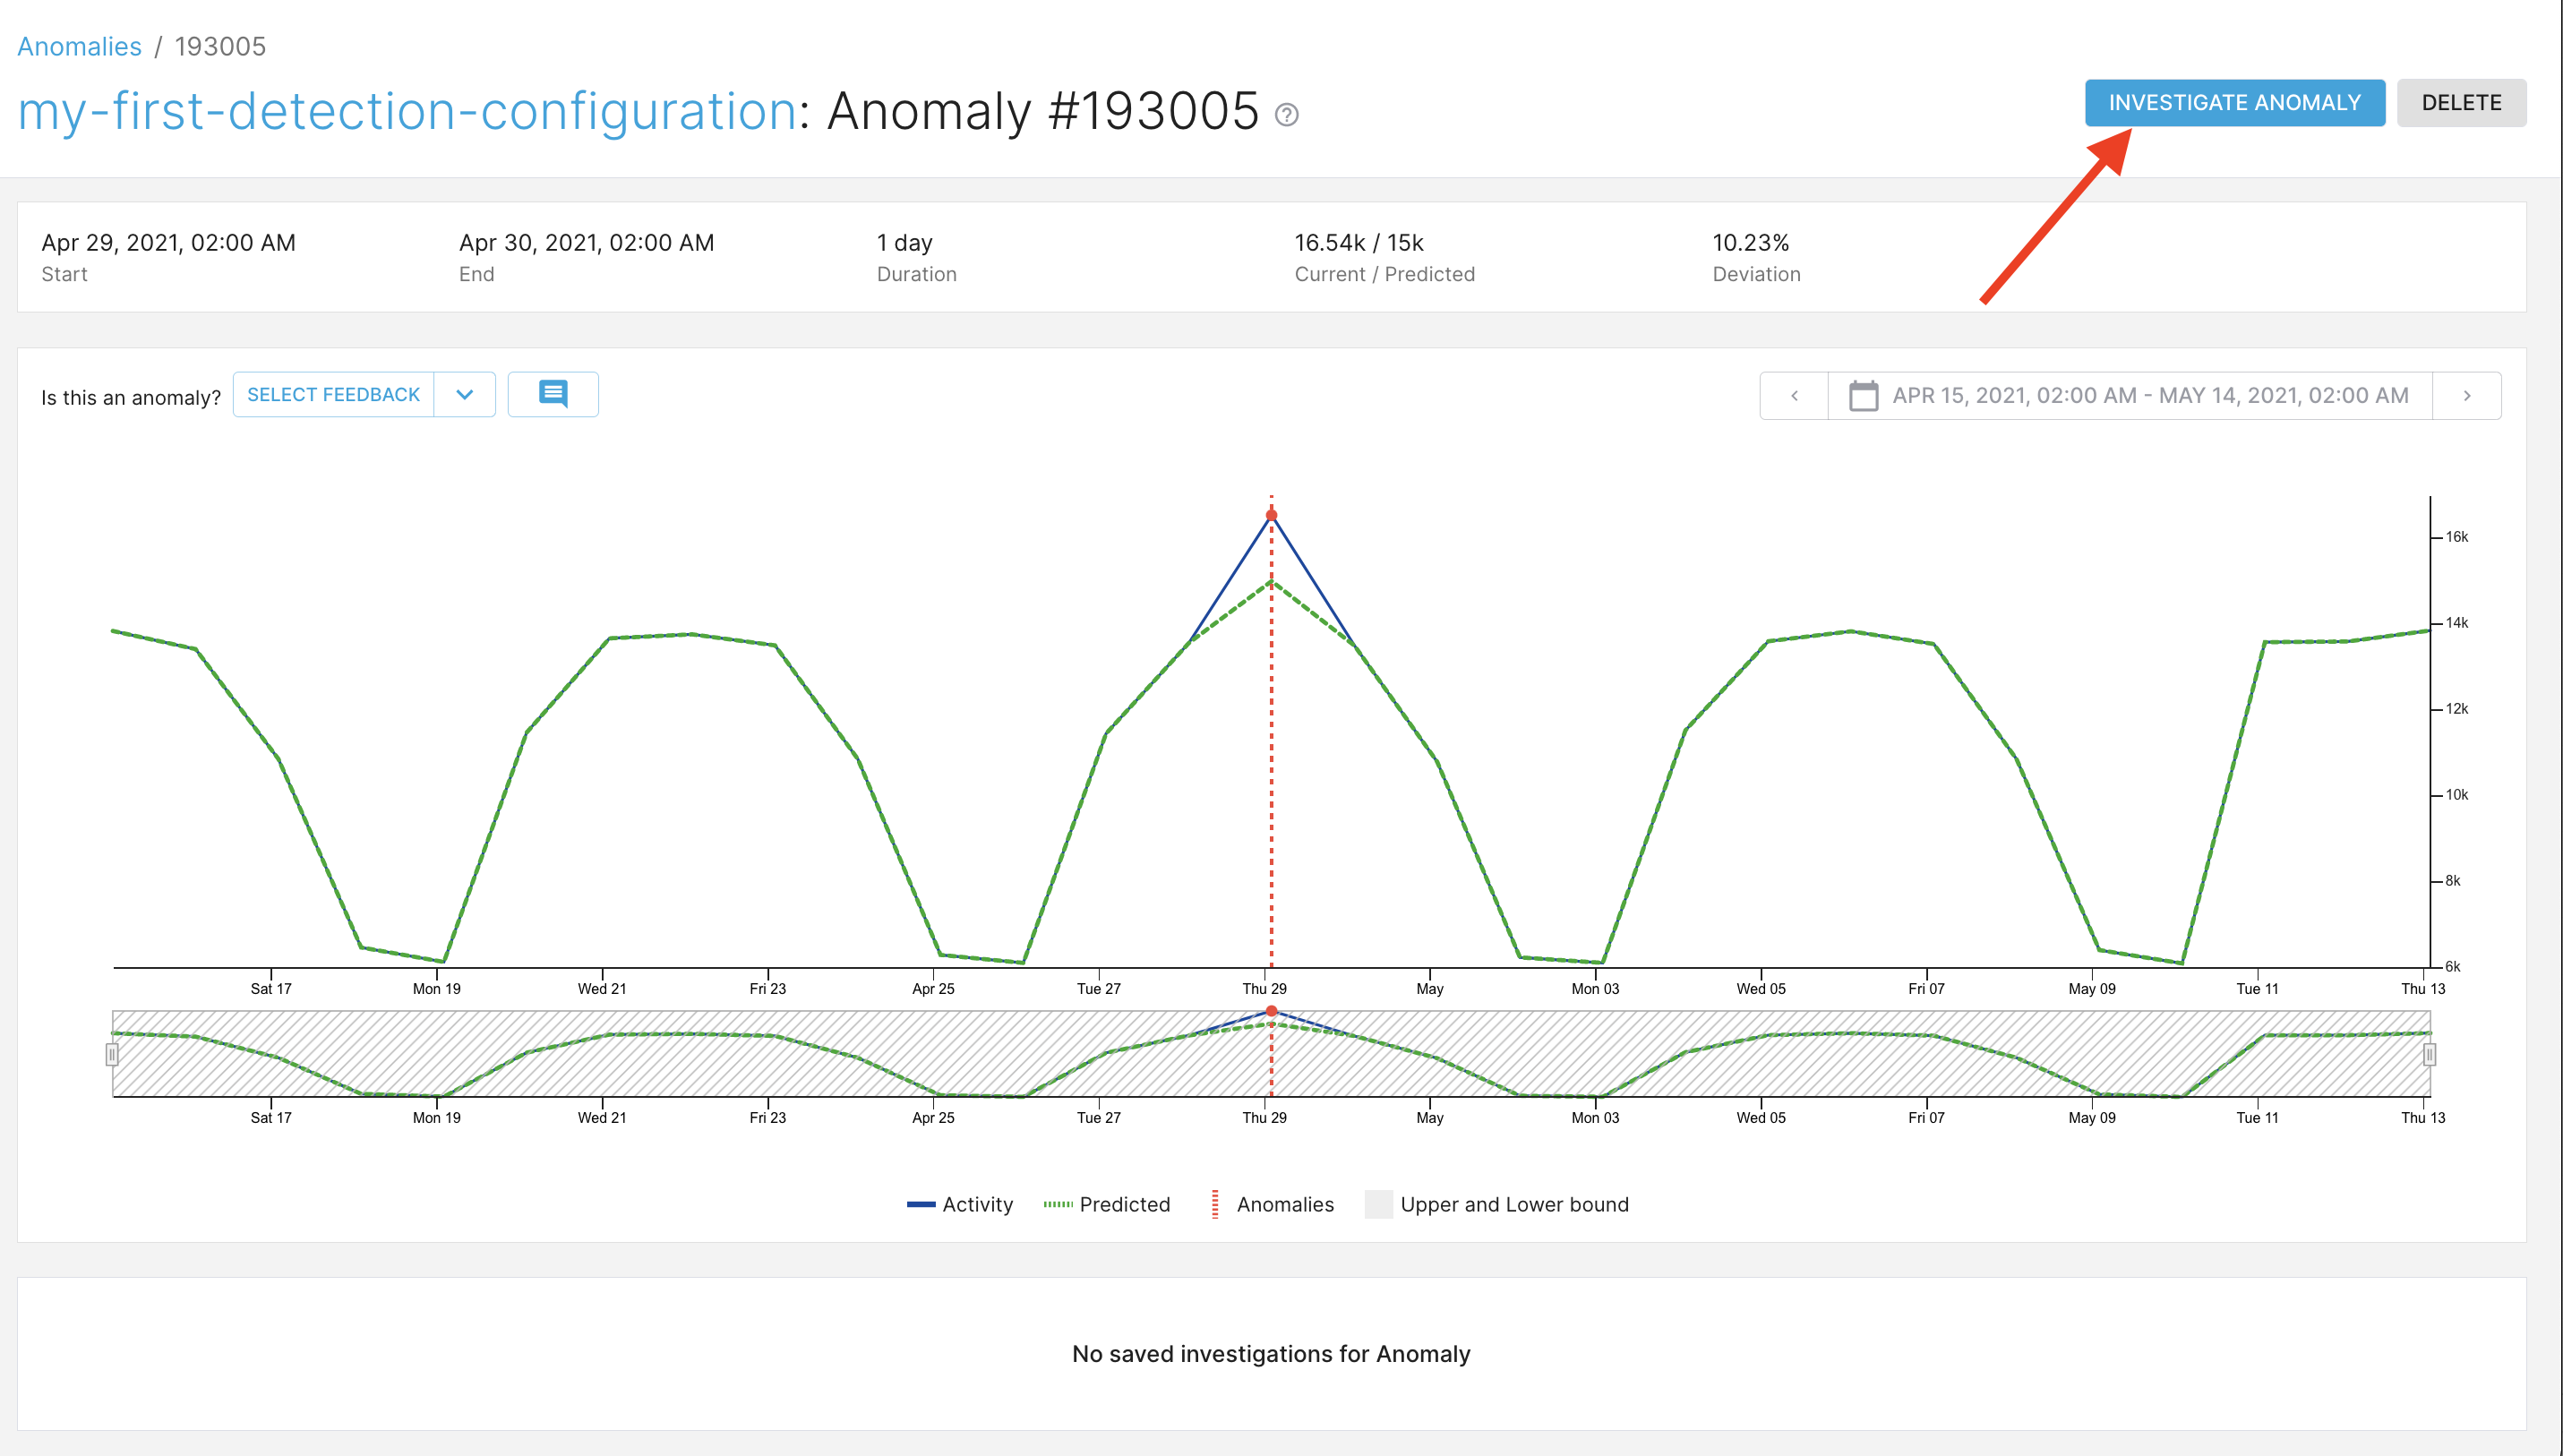
 2. Click investigate to open the root-cause analysis page.
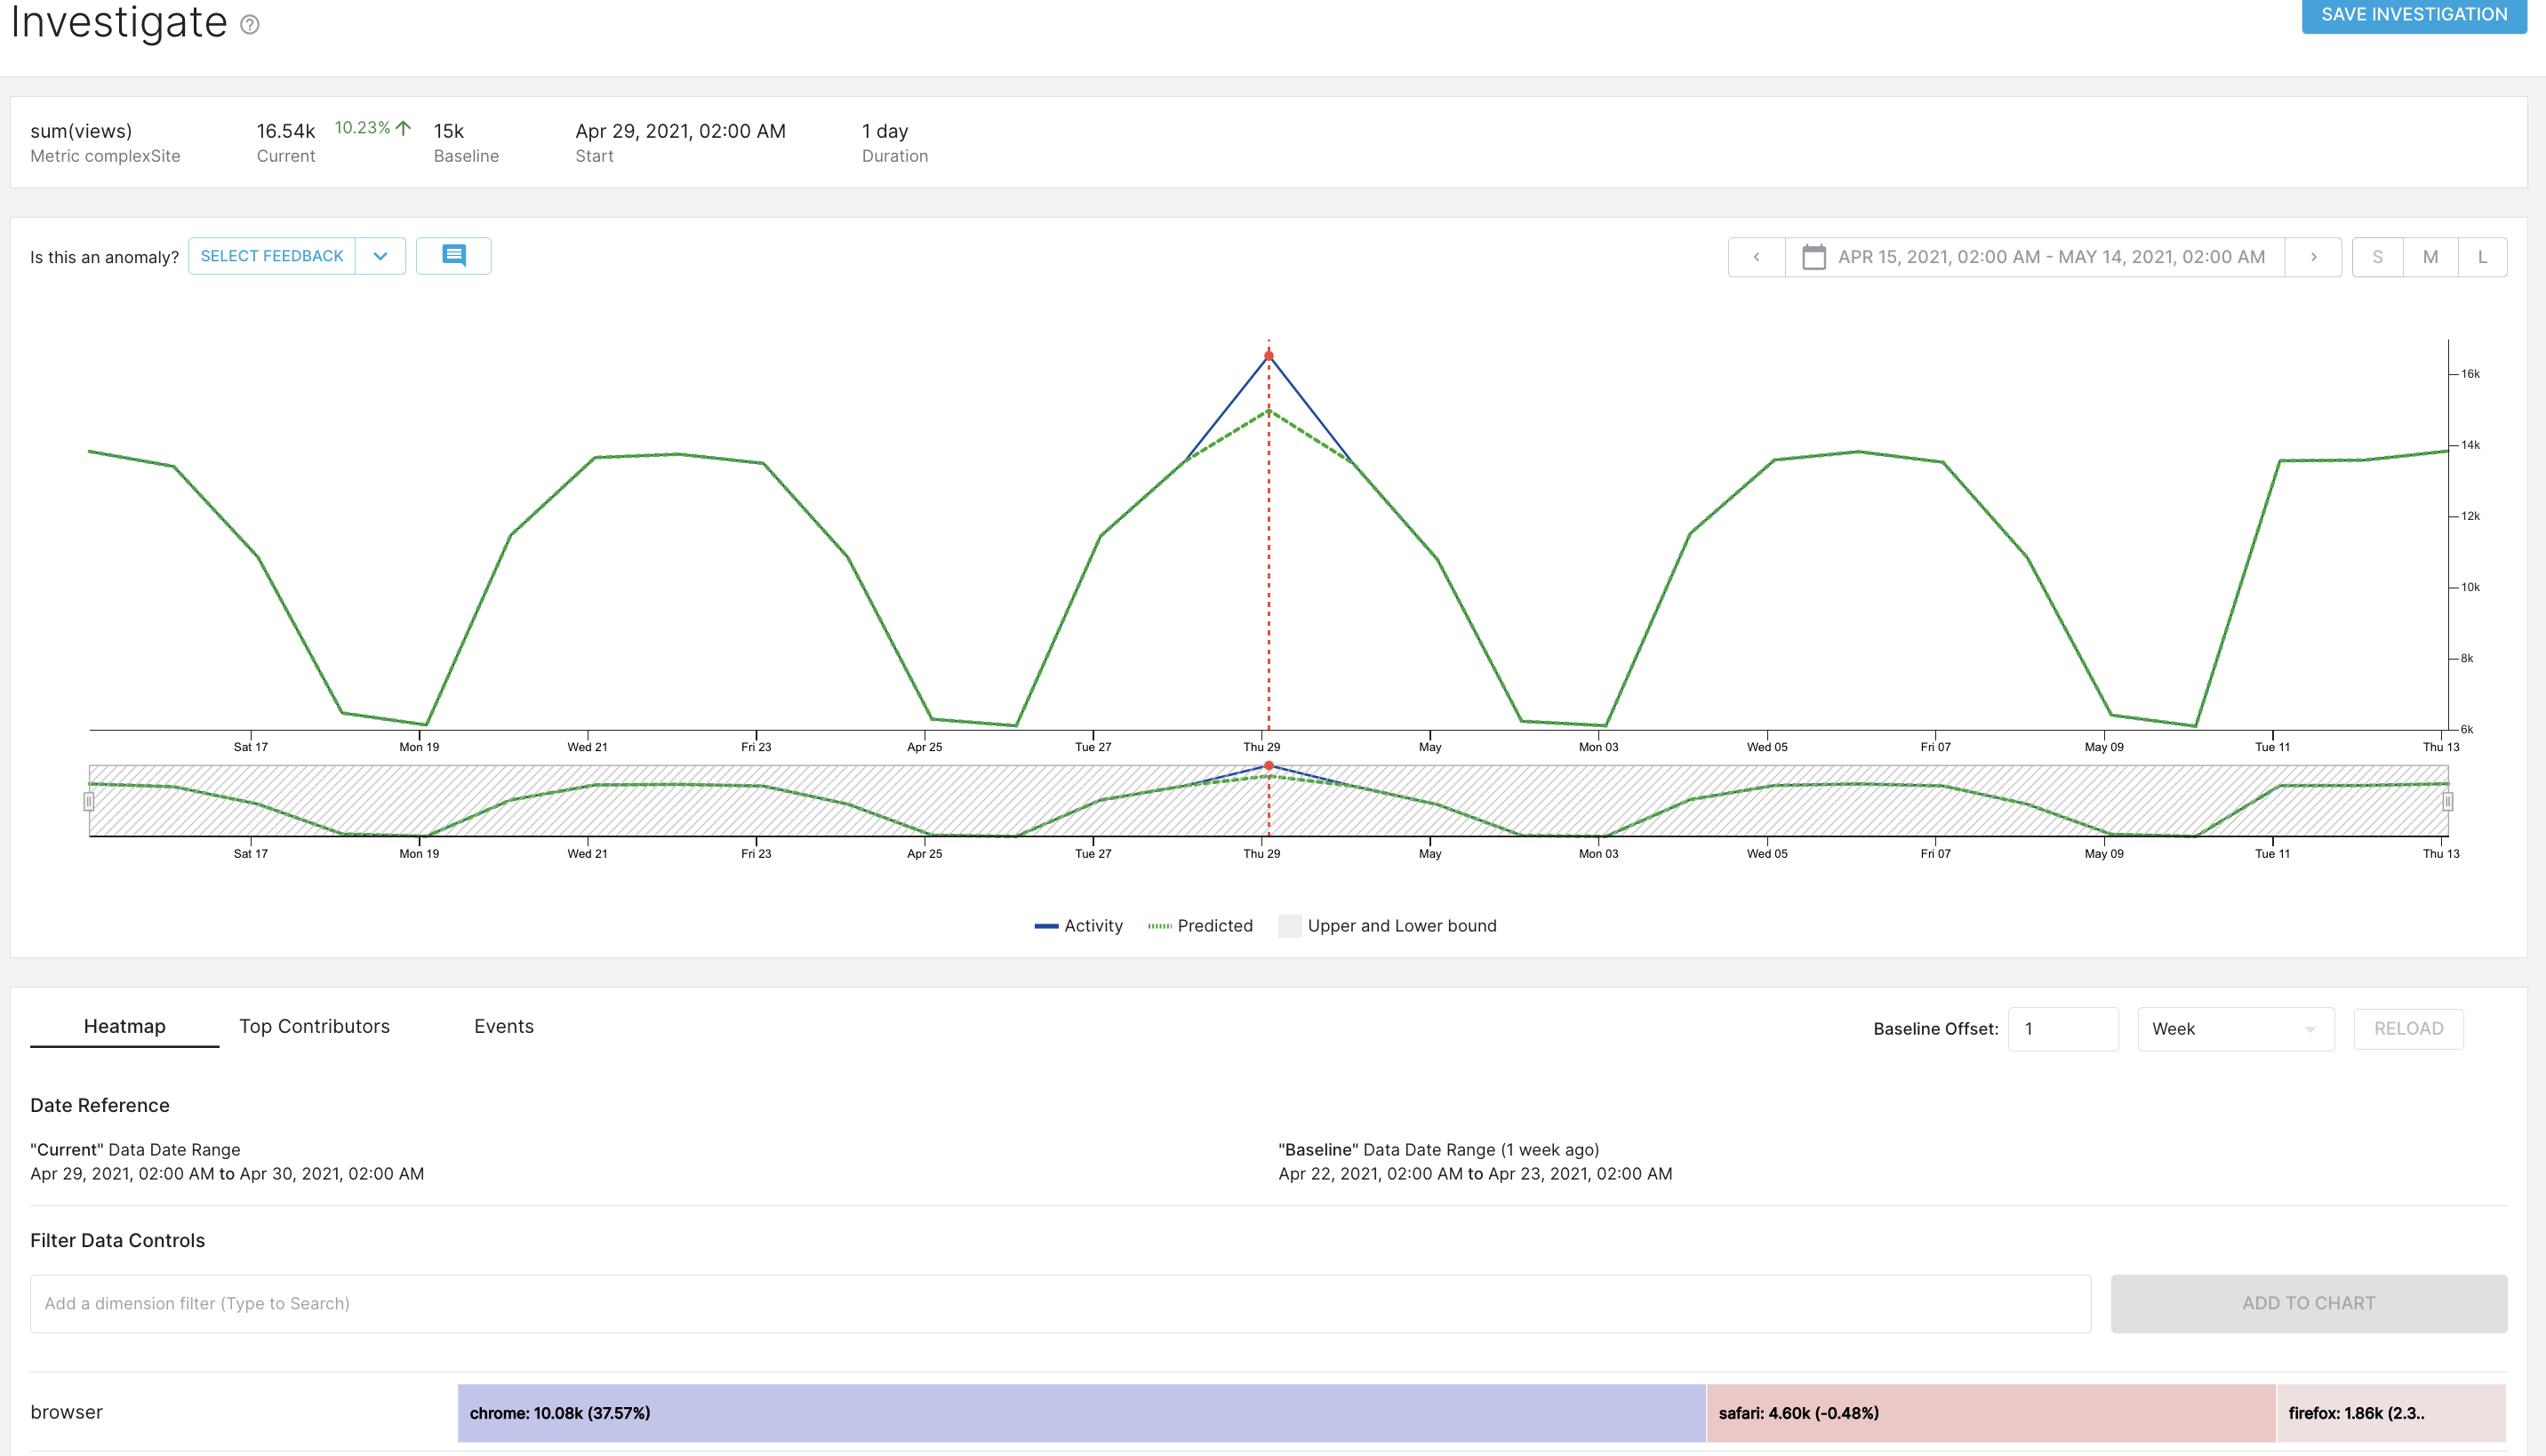
 3. Use the bottom tabs to explore and help you find the root-cause of the anomaly.
 ## Next Steps
Now that you have successfully configured your first alert and inspected an anomaly, explore these links to learn more:
* To learn how to use root cause analysis features in the anomaly pages, see [root cause analysis concepts](/thirdeye/concepts-data-alerts-notifications/concepts-heatmaps)
* To learn more about alert configuration, see [Alert configuration and execution](/thirdeye/alert-configuration).
* To see alert examples, see [create alerts how-tos](/thirdeye/how-tos/alert/how-to-use-alert-creation-ui).
## Next Steps
Now that you have successfully configured your first alert and inspected an anomaly, explore these links to learn more:
* To learn how to use root cause analysis features in the anomaly pages, see [root cause analysis concepts](/thirdeye/concepts-data-alerts-notifications/concepts-heatmaps)
* To learn more about alert configuration, see [Alert configuration and execution](/thirdeye/alert-configuration).
* To see alert examples, see [create alerts how-tos](/thirdeye/how-tos/alert/how-to-use-alert-creation-ui).