> ## Documentation Index
> Fetch the complete documentation index at: https://docs.startree.ai/llms.txt
> Use this file to discover all available pages before exploring further.
# Alert Configuration and Execution
The alert configuration uses a JSON configuration that contains all the logic to fetch and analyze data in order to detect anomalies.
Here's an example alert configuration from the [getting started tutorial](/thirdeye/getting-started/create-your-first-alert):
```json theme={null}
{
"name": "my-first-detection-configuration",
"description": "",
"cron": "0 0 5 ? * * *",
"template": {
"name": "startree-threshold"
},
"templateProperties": {
"dataSource": "pinot",
"dataset": "complexWebsite",
"aggregationFunction": "sum",
"aggregationColumn": "views",
"max": "15000",
"min": "5000",
"monitoringGranularity": "P1D"
}
}
```
*quickstart\_complexWebsite\_alert.json*
Let’s examine this configuration key by key.
## Root structure
### Name
```json theme={null}
"name": "my-first-detection-configuration"
```
The name of the alert. Keep it short.
### Description
```json theme={null}
"description": "Detect anomalies in pageviews."
```
The description of the alert.
### Cron
```json theme={null}
"cron": "0 0/1 * 1/1 * ? *"
```
The cron schedule defines how often and when the detection runs.
The format used is the 6-7 fields Quartz cron format. See [Quartz documentation](https://www.quartz-scheduler.org/documentation/quartz-2.3.0/tutorials/crontrigger.html#introduction).\
A cron expression builder [is available here](https://www.freeformatter.com/cron-expression-generator-quartz.html).
### Template
```json theme={null}
"template": {
"nodes": [ .. .. .. ],
"metadata": { ... }
}
```
The template contains the analysis logic.
* `"nodes"` contains the detection logic: a list of operators that fetch, clean and analyze data.
* `"metadata"` contains metadata used for root cause analysis, search, and data delay management.
The field is called `"template"` because it is meant to be reused.
Templates can be defined independently of alerts and reused by multiple alerts. See [create templates](/thirdeye/how-tos/alert/use-templates).
Inside the template, you can use variables in the format `${myVariable}`. Variables are defined in the `templateProperties`.
### Template properties
```json theme={null}
"templateProperties": {
"key": "value",
}
```
This section lists the values available for the template. You can see them as environment variables.
For instance:
```json theme={null}
"template": {
"nodes": [ {
"type": "AnomalyDetector",
"params": {
"type": "THRESHOLD",
"component.max": "${max}",
}}]
},
"templateProperties": {
"max": 15000
}
```
Will be replaced at runtime by:
```json theme={null}
"template": {
"nodes": [ {
"type": "AnomalyDetector",
"params": {
"type": "THRESHOLD",
"component.max": 15000, // REPLACED HERE
}}]
}
```
## Nodes
### Execution
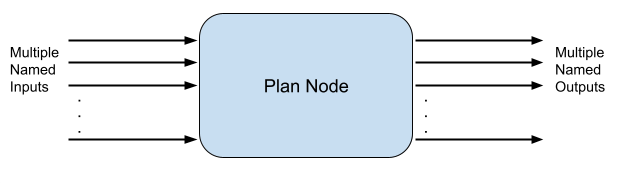
Nodes are the tasks that form the detection plan. They are also called plan nodes.
Nodes can have multiple inputs and outputs. The inputs of nodes are the outputs of other nodes.
 The list of nodes with their input and outputs form an execution DAG, as in this example:
```json theme={null}
"nodes": [
{
"name": "root",
"type": "AnomalyDetector",
"inputs": [
{
"targetProperty": "current",
"sourcePlanNode": "missingDataManager",
"sourceProperty": "currentOutput"
}
],
"outputs": []
},
{
"name": "missingDataManager",
"type": "TimeIndexFiller",
"inputs": [
{
"sourcePlanNode": "currentDataFetcher",
"sourceProperty": "currentOutput"
}
],
"outputs": [
{
"outputName": "currentOutput"
}
]
},
{
"name": "currentDataFetcher",
"type": "DataFetcher",
"inputs": [],
"outputs": [
{
"outputKey": "pinot",
"outputName": "currentOutput"
}
]
}
]
```
An input is defined by:
* a `sourcePlanNode`: the name of another node
* a `sourceProperty`: the name of the output we want in the other node
An output is defined by:
* an `outputKey`: the name of the output to get from the node. Used when a Node can return multiple, distinct outputs.
* an `outputName`: the name by which other nodes can call this output
To understand how node dependencies are resolved, consider the 2 first nodes:
* The **root** node requires one input. This input is from the plan node **missingDataManager** and has the name **currentOuput**.
* The **missingDataManager** node exists, and it returns one output called **currentOuput**: the dependency is correct, **root** depends on **missingDataManager**.
**missingDataManager** will be executed before root.
The execution DAG is constructed using the following algorithm:
1. Start from the root.
2. Resolve the node dependencies.
3. The node dependencies can in turn have dependencies to be resolved. Repeat 2, recursively.
4. Stop when all node dependencies are resolved.
In this example, nodes only have one input and one output.
An example of a node with multiple inputs is the `AnomalyDetector` of type `"PERCENTAGE_CHANGE"`. It compares 2 inputs: a baseline table and a current table. See [multiple inputs alerts](/thirdeye/how-tos/alert/multiple-inputs-alerts).
### Nodes behavior
Now that you know how the detection plan is built, let’s have a look at what’s happening.
#### DataFetcher
The plan starts with the `DataFetcher`. Take the time to read the SQL query.
```json theme={null}
{
"name": "currentDataFetcher",
"type": "DataFetcher",
"params": {
"component.dataSource": "${dataSource}",
"component.query": "SELECT __timeGroup(hoursSinceEpoch, '${timeColumnFormat}', ${monitoringGranularity}) as ts, ${metric} as met FROM ${dataset} WHERE __timeFilter(hoursSinceEpoch, '${timeColumnFormat}') GROUP BY ts ORDER BY ts LIMIT 10000"
},
"inputs": [],
"outputs": [
{
"outputKey": "pinot",
"outputName": "currentOutput"
}
]
}
```
The `DataFetcher` executes the given query and returns the result in the output named `currentOutput`.
Notice the usage of 2 functions:
```sql theme={null}
__timeGroup(hoursSinceEpoch, '${timeColumnFormat}', '${monitoringGranularity}') as ts
__timeFilter(hoursSinceEpoch, '${timeColumnFormat}')
```
These functions are ThirdEye macros: they are translated to correct SQL, depending on the SQL engine. They make it easier to build detection pipelines. They are similar to [Grafana macros](https://grafana.com/docs/grafana/latest/datasources/mysql/).
* `__timeGroup` transforms a timecolumn in bins of a given granularity, in milliseconds. It makes it easy to group by a timecolumn with a specific granularity. In our example, it transforms the column to bins of 1 day. If we ever want to monitor per hour, we can just change `monitoringGranularity` to `P1H`.
* `__timeFilter` is a time range filter. Start and end dates are automatically generated depending on the detection runtime. Refer to the [macro documentation](./operators/data-fetcher.md#macros).
#### TimeIndexFiller
After data is fetched, it is consumed by the `TimeIndexFiller`:
```json theme={null}
{
"name": "missingDataManager",
"type": "TimeIndexFiller",
"params": {
"component.timestamp": "ts"
},
"inputs": [
{
"sourcePlanNode": "currentDataFetcher",
"sourceProperty": "currentOutput"
}
],
"outputs": [
{
"outputName": "currentOutput"
}
]
}
```
Imagine you have no data on a Sunday. Because we group by a time column in the SQL DataFetcher, the Sunday line will be missing. This will cause problems in downstream nodes. `TimeIndexFiller` takes care of this kind of problem.
Notice there is no parameter for this node.
This is because macros used by the `DataFecher` add metadata to result, (granularity, time column, etc…). `TimeIndexFiller` uses this metadata to know how to fill missing points.
If you don’t want to use macros, you can still configure the `TimeIndexFiller` manually.
#### AnomalyDetector
The data finally flows to the `AnomalyDetector` node.
```json theme={null}
{
"name": "root",
"type": "AnomalyDetector",
"params": {
"type": "THRESHOLD",
"component.monitoringGranularity": "P1D",
"component.timestamp": "ts",
"component.metric": "met",
"component.max": "${max}",
"component.min": "${min}",
"anomaly.metric": "${metric}"
},
"inputs": [
{
"targetProperty": "current",
"sourcePlanNode": "missingDataManager",
"sourceProperty": "currentOutput"
}
],
"outputs": []
}
```
The `AnomalyDetector` is of type `"THRESHOLD"`. There are many other types of detector, such as `PERCENTAGE_CHANGE`, `HOLT_WINTERS`, and so on. Parameters prefixed by `component.*` are specific to the detector execution. `component.timestamp` and `component.metric` tell the detector the column names of the time and the metric. See the documentation for [Anomaly detection algorithms](/thirdeye/concepts-data-alerts-notifications/concepts-anomaly-detection-algorithms) to learn more. Notice that there is no output. Anomaly detectors do output anomalies data, but this data is directly consumed by ThirdEye.
## Metadata
This part contains metadata that helps ThirdEye make sense of your alert pipeline. Metadata is used for anomaly filtering in the UI, RCA, and pipeline execution. ThirdEye is designed to give you maximum control over your queries and transformations, but this also means it is not always possible for ThirdEye to infer important information from the pipeline. The metadata fields allow you to explicitly set important metadata.
```json theme={null}
"metadata": {
"datasource": {
"name": "${dataSource}"
},
"dataset": {
"name": "${dataset}",
"completenessDelay": "PT2H"
},
"metric": {
"name": "views",
"where": "browser=chrome"
},
"eventContext": {
"types": ["HOLIDAY"],
"sqlFilter" : "'US' member of dimensionMap['countryCode']"
},
"granularity": "P1D",
"timezone": "Europe/Paris"
}
```
Most of the time, `metadata` values are already used in `nodes`, so it is good practice putting them as template properties like in this example.
### datasource
#### name
```json theme={null}
"name": "${dataSource}"
```
The name of the datasource to use for RCA. Also used for anomaly filtering.
### dataset
#### name
```json theme={null}
"name": "${dataset}"
```
The name of the dataset to use for RCA. Also used for anomaly filtering.
#### completenessDelay
```json theme={null}
"completenessDelay": "PT2H"
```
The time for your data to be considered complete and ready for anomaly detection. In ISO-8601 format. For instance: if you have a streaming system that can ingest data in 2 minutes, but you often have some data points up to 1 hour late, your **completenessDelay** is 1 hour (`PT1H`). ThirdEye will only run detection on data that is complete. Default value is no delay. This is rarely the case in real life.
#### mutabilityPeriod
```json theme={null}
"mutabilityPeriod": "P3D"
```
Used to manage data mutability. [Learn more](/thirdeye/concepts-data-alerts-notifications/concepts-mutable-data). In ISO-8601 format. At each scheduled detection job, TE will re-run the detection on the data in the mutable period. This ensures TE detection results are up-to-date with the latest mutations of data.
#### dimensions
```json theme={null}
"dimensions": ["country", "browser"]
```
List of the dimensions (columns in the dataset) to use in RCA drill-downs. If not set or empty, all dimensions of the table are used.
#### rcaExcludedDimensions
```json theme={null}
"rcaExcludedDimensions": ["os", "device"]
```
List of dimensions (columns in the dataset) to ignore in RCA drill-downs. If not set or empty, all dimensions of the table are used. `dimensions` and `rcaExcludedDimensions` arguments cannot be used at the same time.
### metric
#### name
```json theme={null}
"name": "views"
```
The name of the metric to use for RCA. Can be a column name `col1` or a derived metric expression `2*col1 - col2`.
#### aggregationFunction
```json theme={null}
"aggregationFunction": "count"
```
The aggregation function to use on the metric for RCA. If the metric name is known to ThirdEye, this parameter is optional. ThirdEye will use the default aggregation function of the metric. If the metric is not known to ThirdEye, this parameter must be passed. For instance, you can perform RCA on a count of a dimension column with
```json theme={null}
"name": "myDimension"
"aggregationFunction": "count"
```
#### where
```json theme={null}
"where": "browser=chrome"
```
An SQL filter clause that will be applied for RCA. If you apply some custom filtering in your alert `DataFetcher` query, it is most of the time relevant to apply the same filtering for RCA. Notice that this field accepts `AND browser=chrome` instead of `browser=chrome`. This makes it easy to share custom filter clauses between `DataFetcher` queries and this field using a template property.
### eventContext
#### types
```json theme={null}
"types": ["HOLIDAY"],
```
A list of type to filter on for RCA. Only events that match such types will be shown in the RCA related events tab.
#### sqlFilter
```json theme={null}
"sqlFilter": "'US' member of dimensionMap['countryCode']"
```
An SQL filter for RCA events. Only events that match the filter will be shown in the RCA related events tab. See filter examples [here](/thirdeye/operators/event-fetcher).
### granularity
```json theme={null}
"granularity": "P1D"
```
The granularity of the data when it is passed to the `AnomalyDetector` nodes, in ISO-8601 format. Consider a detection pipeline with a cron that runs every day at 3am. By default, the endTime of the detection pipeline will be 3am. This means the last 0am-3am data will be taken, and put in a day bucket, even though the day is not finished and the data for the day is not complete. This can be avoided by passing a granularity of 1 day (`P1D`). ThirdEye will not take the 0am-3am because it is not a complete day. With *granularity*, ThirdEye only runs detection for periods that are complete. This can be combined with the `completenessDelay` parameter.
### timezone
```json theme={null}
"timezone": "Europe/Paris"
```
Timezone to use for the alert. In [TZ database format](https://en.wikipedia.org/wiki/List_of_tz_database_time_zones#List). Defaults to `UTC`.
The timezone is used:
* To apply [`completenessDelay`](#completenessdelay) and [`granularity`](#granularity)
* By the [DataFetcher](#datafetcher) macros `__timeGroup` and `__timeFilter`.
* By the [TimeIndexFiller](/thirdeye/operators/time-index-filler)
* By the [AnomalyDetectors](/thirdeye/operators/anomaly-detector), to compute the right boundary of a top-right anomaly
* To merge anomalies
Metadata fields are not mandatory. You can start without metadata and update the alert configuration later if you need RCA. RCA is available as soon as the metadata fields are set.
The list of nodes with their input and outputs form an execution DAG, as in this example:
```json theme={null}
"nodes": [
{
"name": "root",
"type": "AnomalyDetector",
"inputs": [
{
"targetProperty": "current",
"sourcePlanNode": "missingDataManager",
"sourceProperty": "currentOutput"
}
],
"outputs": []
},
{
"name": "missingDataManager",
"type": "TimeIndexFiller",
"inputs": [
{
"sourcePlanNode": "currentDataFetcher",
"sourceProperty": "currentOutput"
}
],
"outputs": [
{
"outputName": "currentOutput"
}
]
},
{
"name": "currentDataFetcher",
"type": "DataFetcher",
"inputs": [],
"outputs": [
{
"outputKey": "pinot",
"outputName": "currentOutput"
}
]
}
]
```
An input is defined by:
* a `sourcePlanNode`: the name of another node
* a `sourceProperty`: the name of the output we want in the other node
An output is defined by:
* an `outputKey`: the name of the output to get from the node. Used when a Node can return multiple, distinct outputs.
* an `outputName`: the name by which other nodes can call this output
To understand how node dependencies are resolved, consider the 2 first nodes:
* The **root** node requires one input. This input is from the plan node **missingDataManager** and has the name **currentOuput**.
* The **missingDataManager** node exists, and it returns one output called **currentOuput**: the dependency is correct, **root** depends on **missingDataManager**.
**missingDataManager** will be executed before root.
The execution DAG is constructed using the following algorithm:
1. Start from the root.
2. Resolve the node dependencies.
3. The node dependencies can in turn have dependencies to be resolved. Repeat 2, recursively.
4. Stop when all node dependencies are resolved.
In this example, nodes only have one input and one output.
An example of a node with multiple inputs is the `AnomalyDetector` of type `"PERCENTAGE_CHANGE"`. It compares 2 inputs: a baseline table and a current table. See [multiple inputs alerts](/thirdeye/how-tos/alert/multiple-inputs-alerts).
### Nodes behavior
Now that you know how the detection plan is built, let’s have a look at what’s happening.
#### DataFetcher
The plan starts with the `DataFetcher`. Take the time to read the SQL query.
```json theme={null}
{
"name": "currentDataFetcher",
"type": "DataFetcher",
"params": {
"component.dataSource": "${dataSource}",
"component.query": "SELECT __timeGroup(hoursSinceEpoch, '${timeColumnFormat}', ${monitoringGranularity}) as ts, ${metric} as met FROM ${dataset} WHERE __timeFilter(hoursSinceEpoch, '${timeColumnFormat}') GROUP BY ts ORDER BY ts LIMIT 10000"
},
"inputs": [],
"outputs": [
{
"outputKey": "pinot",
"outputName": "currentOutput"
}
]
}
```
The `DataFetcher` executes the given query and returns the result in the output named `currentOutput`.
Notice the usage of 2 functions:
```sql theme={null}
__timeGroup(hoursSinceEpoch, '${timeColumnFormat}', '${monitoringGranularity}') as ts
__timeFilter(hoursSinceEpoch, '${timeColumnFormat}')
```
These functions are ThirdEye macros: they are translated to correct SQL, depending on the SQL engine. They make it easier to build detection pipelines. They are similar to [Grafana macros](https://grafana.com/docs/grafana/latest/datasources/mysql/).
* `__timeGroup` transforms a timecolumn in bins of a given granularity, in milliseconds. It makes it easy to group by a timecolumn with a specific granularity. In our example, it transforms the column to bins of 1 day. If we ever want to monitor per hour, we can just change `monitoringGranularity` to `P1H`.
* `__timeFilter` is a time range filter. Start and end dates are automatically generated depending on the detection runtime. Refer to the [macro documentation](./operators/data-fetcher.md#macros).
#### TimeIndexFiller
After data is fetched, it is consumed by the `TimeIndexFiller`:
```json theme={null}
{
"name": "missingDataManager",
"type": "TimeIndexFiller",
"params": {
"component.timestamp": "ts"
},
"inputs": [
{
"sourcePlanNode": "currentDataFetcher",
"sourceProperty": "currentOutput"
}
],
"outputs": [
{
"outputName": "currentOutput"
}
]
}
```
Imagine you have no data on a Sunday. Because we group by a time column in the SQL DataFetcher, the Sunday line will be missing. This will cause problems in downstream nodes. `TimeIndexFiller` takes care of this kind of problem.
Notice there is no parameter for this node.
This is because macros used by the `DataFecher` add metadata to result, (granularity, time column, etc…). `TimeIndexFiller` uses this metadata to know how to fill missing points.
If you don’t want to use macros, you can still configure the `TimeIndexFiller` manually.
#### AnomalyDetector
The data finally flows to the `AnomalyDetector` node.
```json theme={null}
{
"name": "root",
"type": "AnomalyDetector",
"params": {
"type": "THRESHOLD",
"component.monitoringGranularity": "P1D",
"component.timestamp": "ts",
"component.metric": "met",
"component.max": "${max}",
"component.min": "${min}",
"anomaly.metric": "${metric}"
},
"inputs": [
{
"targetProperty": "current",
"sourcePlanNode": "missingDataManager",
"sourceProperty": "currentOutput"
}
],
"outputs": []
}
```
The `AnomalyDetector` is of type `"THRESHOLD"`. There are many other types of detector, such as `PERCENTAGE_CHANGE`, `HOLT_WINTERS`, and so on. Parameters prefixed by `component.*` are specific to the detector execution. `component.timestamp` and `component.metric` tell the detector the column names of the time and the metric. See the documentation for [Anomaly detection algorithms](/thirdeye/concepts-data-alerts-notifications/concepts-anomaly-detection-algorithms) to learn more. Notice that there is no output. Anomaly detectors do output anomalies data, but this data is directly consumed by ThirdEye.
## Metadata
This part contains metadata that helps ThirdEye make sense of your alert pipeline. Metadata is used for anomaly filtering in the UI, RCA, and pipeline execution. ThirdEye is designed to give you maximum control over your queries and transformations, but this also means it is not always possible for ThirdEye to infer important information from the pipeline. The metadata fields allow you to explicitly set important metadata.
```json theme={null}
"metadata": {
"datasource": {
"name": "${dataSource}"
},
"dataset": {
"name": "${dataset}",
"completenessDelay": "PT2H"
},
"metric": {
"name": "views",
"where": "browser=chrome"
},
"eventContext": {
"types": ["HOLIDAY"],
"sqlFilter" : "'US' member of dimensionMap['countryCode']"
},
"granularity": "P1D",
"timezone": "Europe/Paris"
}
```
Most of the time, `metadata` values are already used in `nodes`, so it is good practice putting them as template properties like in this example.
### datasource
#### name
```json theme={null}
"name": "${dataSource}"
```
The name of the datasource to use for RCA. Also used for anomaly filtering.
### dataset
#### name
```json theme={null}
"name": "${dataset}"
```
The name of the dataset to use for RCA. Also used for anomaly filtering.
#### completenessDelay
```json theme={null}
"completenessDelay": "PT2H"
```
The time for your data to be considered complete and ready for anomaly detection. In ISO-8601 format. For instance: if you have a streaming system that can ingest data in 2 minutes, but you often have some data points up to 1 hour late, your **completenessDelay** is 1 hour (`PT1H`). ThirdEye will only run detection on data that is complete. Default value is no delay. This is rarely the case in real life.
#### mutabilityPeriod
```json theme={null}
"mutabilityPeriod": "P3D"
```
Used to manage data mutability. [Learn more](/thirdeye/concepts-data-alerts-notifications/concepts-mutable-data). In ISO-8601 format. At each scheduled detection job, TE will re-run the detection on the data in the mutable period. This ensures TE detection results are up-to-date with the latest mutations of data.
#### dimensions
```json theme={null}
"dimensions": ["country", "browser"]
```
List of the dimensions (columns in the dataset) to use in RCA drill-downs. If not set or empty, all dimensions of the table are used.
#### rcaExcludedDimensions
```json theme={null}
"rcaExcludedDimensions": ["os", "device"]
```
List of dimensions (columns in the dataset) to ignore in RCA drill-downs. If not set or empty, all dimensions of the table are used. `dimensions` and `rcaExcludedDimensions` arguments cannot be used at the same time.
### metric
#### name
```json theme={null}
"name": "views"
```
The name of the metric to use for RCA. Can be a column name `col1` or a derived metric expression `2*col1 - col2`.
#### aggregationFunction
```json theme={null}
"aggregationFunction": "count"
```
The aggregation function to use on the metric for RCA. If the metric name is known to ThirdEye, this parameter is optional. ThirdEye will use the default aggregation function of the metric. If the metric is not known to ThirdEye, this parameter must be passed. For instance, you can perform RCA on a count of a dimension column with
```json theme={null}
"name": "myDimension"
"aggregationFunction": "count"
```
#### where
```json theme={null}
"where": "browser=chrome"
```
An SQL filter clause that will be applied for RCA. If you apply some custom filtering in your alert `DataFetcher` query, it is most of the time relevant to apply the same filtering for RCA. Notice that this field accepts `AND browser=chrome` instead of `browser=chrome`. This makes it easy to share custom filter clauses between `DataFetcher` queries and this field using a template property.
### eventContext
#### types
```json theme={null}
"types": ["HOLIDAY"],
```
A list of type to filter on for RCA. Only events that match such types will be shown in the RCA related events tab.
#### sqlFilter
```json theme={null}
"sqlFilter": "'US' member of dimensionMap['countryCode']"
```
An SQL filter for RCA events. Only events that match the filter will be shown in the RCA related events tab. See filter examples [here](/thirdeye/operators/event-fetcher).
### granularity
```json theme={null}
"granularity": "P1D"
```
The granularity of the data when it is passed to the `AnomalyDetector` nodes, in ISO-8601 format. Consider a detection pipeline with a cron that runs every day at 3am. By default, the endTime of the detection pipeline will be 3am. This means the last 0am-3am data will be taken, and put in a day bucket, even though the day is not finished and the data for the day is not complete. This can be avoided by passing a granularity of 1 day (`P1D`). ThirdEye will not take the 0am-3am because it is not a complete day. With *granularity*, ThirdEye only runs detection for periods that are complete. This can be combined with the `completenessDelay` parameter.
### timezone
```json theme={null}
"timezone": "Europe/Paris"
```
Timezone to use for the alert. In [TZ database format](https://en.wikipedia.org/wiki/List_of_tz_database_time_zones#List). Defaults to `UTC`.
The timezone is used:
* To apply [`completenessDelay`](#completenessdelay) and [`granularity`](#granularity)
* By the [DataFetcher](#datafetcher) macros `__timeGroup` and `__timeFilter`.
* By the [TimeIndexFiller](/thirdeye/operators/time-index-filler)
* By the [AnomalyDetectors](/thirdeye/operators/anomaly-detector), to compute the right boundary of a top-right anomaly
* To merge anomalies
Metadata fields are not mandatory. You can start without metadata and update the alert configuration later if you need RCA. RCA is available as soon as the metadata fields are set.